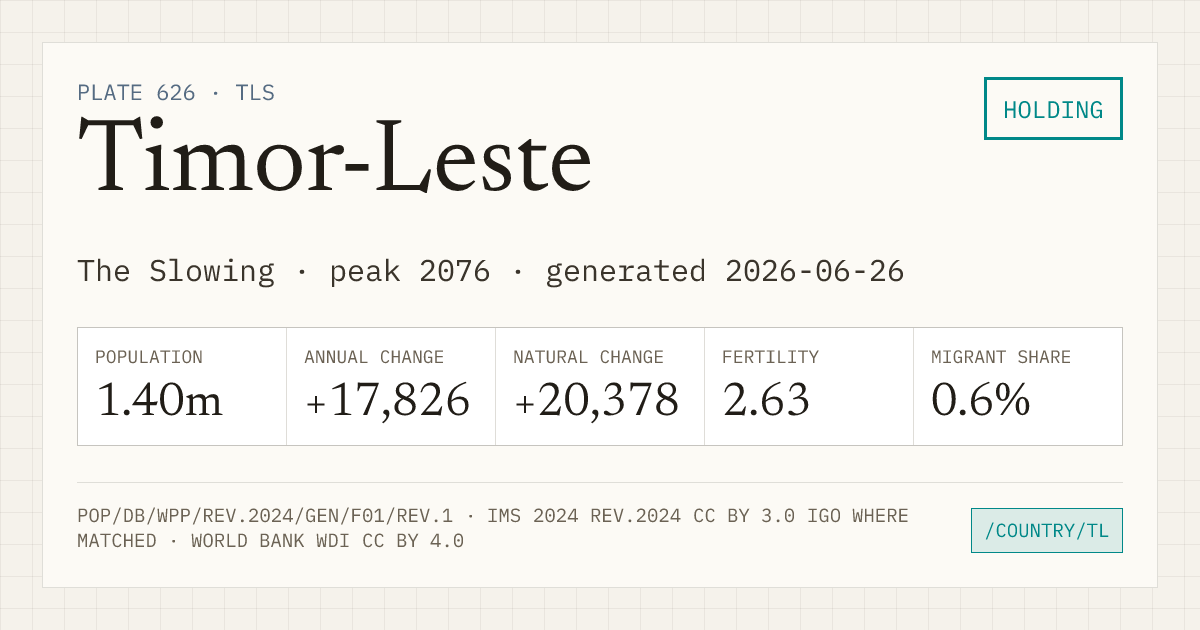
Timor-Leste
- Fertility
- 2.63 164 of 237 with a TFR, lowest first
- World population rank
- 156 of 237
- Regional population rank
- 46 of 51 in Asia
- Population
- 1.40m
- Annual change
- +17,826
- Natural change
- +20,378
- Migrant share
- 0.6%
What drives population change?
Births and deaths set natural change. Net migration can reinforce, reduce, or reverse that direction.
Negative net migration slows natural growth without reversing it.
Timor-Leste, 2024 projected: natural change +20,378 people, net migration −2,552, WPP adjustment 0, total population change +17,826. Negative net migration slows natural growth without reversing it.
Exact reconciliation: WPP includes a 0-person statistical adjustment. Figures are rounded to whole people.
SOURCE · UN WPP 2024 CHECKS PASSED · DETAILS⌄
Growth in this series
- Current run
- Since 2000 25 consecutive years · projected 2024
- Latest annual gain
- +17,826 1.27% of 2024 population
- Series maximum
- projected 2076 Projected from the WPP medium variant, not a forecast.
Timor-Leste observed 2023 population pyramid. Mirrored bars compare male and female population from oldest to youngest across 85+, 80–84, 75–79, 70–74, 65–69, 60–64, 55–59, 50–54, 45–49, 40–44, 35–39, 30–34, 25–29, 20–24, 15–19, 10–14, 5–9, 0–4 age bands.
| Year | Population | Annual change | Fertility |
|---|---|---|---|
| 2024 | 1.40m | +17,826 | 2.63 |
| 2050 | 1.89m | +16,705 | 1.92 |
| 2080 | 2.09m | −2,910 | 1.76 |
| 2100 | 1.97m | −4,689 | 1.72 |
Values after 2023 are medium-variant projections, not forecasts.
Youth and older population
Annual share of the population aged under 18 and aged 65+. The crossing shows when the older group first becomes larger in the annual source series.
- First annual crossover
- 2084 · projected
- Rule
- 65+ strictly exceeds under 18
Timor-Leste annual age balance from 1950 to 2100. Under-18 population moves from 49.7% in 1950 to 41.1% in 2023 and 18.4% in the 2100 projection. Population aged 65 and older moves from 3.1% to 5.3% and 23.3%. First annual crossover: 2084 · projected. Estimates run through 2023 and WPP Medium projections begin in 2024.
- 1950
- Under 18 · 49.7%65+ · 3.1%
- 2023 observed
- Under 18 · 41.1%65+ · 5.3%
- 2100 projected
- Under 18 · 18.4%65+ · 23.3%
Annual evidence · 151 source rows
| Year | Evidence | Under 18 | Share | 65+ | Share |
|---|---|---|---|---|---|
| 1950 | observed | 206,321 | 49.7% | 13,010 | 3.1% |
| 1951 | observed | 207,485 | 49.6% | 13,117 | 3.1% |
| 1952 | observed | 208,984 | 49.5% | 13,263 | 3.1% |
| 1953 | observed | 210,481 | 49.3% | 13,392 | 3.1% |
| 1954 | observed | 211,903 | 49.1% | 13,397 | 3.1% |
| 1955 | observed | 213,145 | 48.8% | 13,263 | 3.0% |
| 1956 | observed | 214,345 | 48.4% | 13,018 | 2.9% |
| 1957 | observed | 215,734 | 48.1% | 12,674 | 2.8% |
| 1958 | observed | 217,370 | 47.8% | 12,299 | 2.7% |
| 1959 | observed | 219,178 | 47.5% | 12,013 | 2.6% |
| 1960 | observed | 221,111 | 47.2% | 11,877 | 2.5% |
| 1961 | observed | 223,146 | 46.9% | 11,859 | 2.5% |
| 1962 | observed | 225,248 | 46.7% | 11,943 | 2.5% |
| 1963 | observed | 227,349 | 46.3% | 12,130 | 2.5% |
| 1964 | observed | 229,432 | 46.0% | 12,398 | 2.5% |
| 1965 | observed | 231,513 | 45.7% | 12,716 | 2.5% |
| 1966 | observed | 234,047 | 45.4% | 13,091 | 2.5% |
| 1967 | observed | 236,707 | 45.1% | 13,554 | 2.6% |
| 1968 | observed | 240,539 | 45.1% | 14,037 | 2.6% |
| 1969 | observed | 245,855 | 45.2% | 14,489 | 2.7% |
| 1970 | observed | 251,167 | 45.4% | 14,879 | 2.7% |
| 1971 | observed | 256,430 | 45.5% | 15,225 | 2.7% |
| 1972 | observed | 261,558 | 45.7% | 15,513 | 2.7% |
| 1973 | observed | 266,452 | 45.7% | 15,761 | 2.7% |
| 1974 | observed | 270,337 | 45.8% | 15,961 | 2.7% |
| 1975 | observed | 272,609 | 45.6% | 15,985 | 2.7% |
| 1976 | observed | 274,694 | 45.2% | 15,952 | 2.6% |
| 1977 | observed | 277,158 | 44.8% | 15,974 | 2.6% |
| 1978 | observed | 278,979 | 44.4% | 15,945 | 2.5% |
| 1979 | observed | 280,846 | 44.0% | 15,926 | 2.5% |
| 1980 | observed | 285,027 | 43.9% | 16,133 | 2.5% |
| 1981 | observed | 292,245 | 44.2% | 16,464 | 2.5% |
| 1982 | observed | 300,192 | 44.9% | 16,762 | 2.5% |
| 1983 | observed | 307,407 | 45.4% | 17,029 | 2.5% |
| 1984 | observed | 314,473 | 45.8% | 17,221 | 2.5% |
| 1985 | observed | 321,760 | 46.2% | 17,335 | 2.5% |
| 1986 | observed | 329,319 | 46.6% | 17,334 | 2.5% |
| 1987 | observed | 337,423 | 47.0% | 17,225 | 2.4% |
| 1988 | observed | 346,394 | 47.4% | 17,025 | 2.3% |
| 1989 | observed | 355,929 | 47.8% | 16,772 | 2.3% |
| 1990 | observed | 365,032 | 48.0% | 16,585 | 2.2% |
| 1991 | observed | 374,322 | 48.1% | 16,801 | 2.2% |
| 1992 | observed | 384,948 | 48.2% | 17,393 | 2.2% |
| 1993 | observed | 396,580 | 48.3% | 18,027 | 2.2% |
| 1994 | observed | 409,007 | 48.4% | 18,715 | 2.2% |
| 1995 | observed | 421,872 | 48.6% | 19,416 | 2.2% |
| 1996 | observed | 434,901 | 48.7% | 20,151 | 2.3% |
| 1997 | observed | 448,146 | 48.9% | 20,925 | 2.3% |
| 1998 | observed | 461,166 | 48.9% | 21,725 | 2.3% |
| 1999 | observed | 408,860 | 49.0% | 19,438 | 2.3% |
| 2000 | observed | 365,456 | 49.0% | 17,655 | 2.4% |
| 2001 | observed | 398,395 | 49.0% | 19,670 | 2.4% |
| 2002 | observed | 430,766 | 49.0% | 21,779 | 2.5% |
| 2003 | observed | 448,308 | 48.9% | 23,269 | 2.5% |
| 2004 | observed | 452,754 | 48.7% | 24,195 | 2.6% |
| 2005 | observed | 461,409 | 48.7% | 26,123 | 2.8% |
| 2006 | observed | 475,532 | 48.7% | 29,314 | 3.0% |
| 2007 | observed | 489,487 | 48.7% | 33,031 | 3.3% |
| 2008 | observed | 502,485 | 48.7% | 37,441 | 3.6% |
| 2009 | observed | 513,728 | 48.5% | 42,667 | 4.0% |
| 2010 | observed | 523,585 | 48.3% | 48,014 | 4.4% |
| 2011 | observed | 532,587 | 48.0% | 52,163 | 4.7% |
| 2012 | observed | 540,676 | 47.6% | 55,277 | 4.9% |
| 2013 | observed | 547,641 | 47.3% | 58,103 | 5.0% |
| 2014 | observed | 553,348 | 46.8% | 60,734 | 5.1% |
| 2015 | observed | 557,766 | 46.3% | 63,399 | 5.3% |
| 2016 | observed | 560,628 | 45.6% | 66,203 | 5.4% |
| 2017 | observed | 562,999 | 45.0% | 68,774 | 5.5% |
| 2018 | observed | 566,090 | 44.4% | 70,808 | 5.5% |
| 2019 | observed | 569,670 | 43.8% | 72,335 | 5.6% |
| 2020 | observed | 572,998 | 43.2% | 73,408 | 5.5% |
| 2021 | observed | 574,998 | 42.6% | 73,997 | 5.5% |
| 2022 | observed | 573,380 | 41.9% | 74,016 | 5.4% |
| 2023 | observed | 569,052 | 41.1% | 73,840 | 5.3% |
| 2024 | projected | 564,978 | 40.3% | 73,920 | 5.3% |
| 2025 | projected | 561,533 | 39.6% | 74,170 | 5.2% |
| 2026 | projected | 558,914 | 38.9% | 74,553 | 5.2% |
| 2027 | projected | 557,389 | 38.3% | 74,998 | 5.1% |
| 2028 | projected | 556,847 | 37.7% | 75,569 | 5.1% |
| 2029 | projected | 556,837 | 37.2% | 76,352 | 5.1% |
| 2030 | projected | 556,932 | 36.6% | 77,329 | 5.1% |
| 2031 | projected | 556,410 | 36.1% | 78,511 | 5.1% |
| 2032 | projected | 554,689 | 35.6% | 79,982 | 5.1% |
| 2033 | projected | 551,952 | 35.0% | 81,884 | 5.2% |
| 2034 | projected | 548,731 | 34.4% | 84,227 | 5.3% |
| 2035 | projected | 545,527 | 33.7% | 86,912 | 5.4% |
| 2036 | projected | 542,076 | 33.1% | 89,775 | 5.5% |
| 2037 | projected | 538,677 | 32.5% | 92,728 | 5.6% |
| 2038 | projected | 536,305 | 31.9% | 95,900 | 5.7% |
| 2039 | projected | 535,480 | 31.5% | 99,171 | 5.8% |
| 2040 | projected | 535,887 | 31.2% | 102,127 | 5.9% |
| 2041 | projected | 536,571 | 30.9% | 104,439 | 6.0% |
| 2042 | projected | 537,454 | 30.6% | 106,122 | 6.0% |
| 2043 | projected | 538,310 | 30.3% | 107,444 | 6.0% |
| 2044 | projected | 538,207 | 30.0% | 108,814 | 6.1% |
| 2045 | projected | 537,279 | 29.7% | 110,701 | 6.1% |
| 2046 | projected | 535,932 | 29.4% | 113,455 | 6.2% |
| 2047 | projected | 534,180 | 29.0% | 117,131 | 6.4% |
| 2048 | projected | 532,257 | 28.6% | 121,669 | 6.5% |
| 2049 | projected | 529,750 | 28.3% | 126,846 | 6.8% |
| 2050 | projected | 526,956 | 27.9% | 132,479 | 7.0% |
| 2051 | projected | 523,560 | 27.5% | 138,386 | 7.3% |
| 2052 | projected | 519,649 | 27.1% | 144,470 | 7.5% |
| 2053 | projected | 516,338 | 26.8% | 150,853 | 7.8% |
| 2054 | projected | 512,443 | 26.4% | 157,267 | 8.1% |
| 2055 | projected | 508,159 | 26.0% | 163,679 | 8.4% |
| 2056 | projected | 504,606 | 25.7% | 170,299 | 8.7% |
| 2057 | projected | 501,031 | 25.3% | 177,100 | 9.0% |
| 2058 | projected | 497,206 | 25.0% | 184,222 | 9.3% |
| 2059 | projected | 493,287 | 24.7% | 191,750 | 9.6% |
| 2060 | projected | 489,064 | 24.3% | 199,636 | 9.9% |
| 2061 | projected | 484,481 | 24.0% | 207,873 | 10.3% |
| 2062 | projected | 480,067 | 23.7% | 216,601 | 10.7% |
| 2063 | projected | 476,277 | 23.5% | 225,872 | 11.1% |
| 2064 | projected | 472,884 | 23.2% | 235,589 | 11.6% |
| 2065 | projected | 469,640 | 23.0% | 245,708 | 12.0% |
| 2066 | projected | 466,830 | 22.7% | 256,307 | 12.5% |
| 2067 | projected | 464,305 | 22.5% | 267,387 | 13.0% |
| 2068 | projected | 461,916 | 22.3% | 278,812 | 13.5% |
| 2069 | projected | 459,675 | 22.2% | 290,452 | 14.0% |
| 2070 | projected | 457,143 | 22.0% | 301,959 | 14.5% |
| 2071 | projected | 455,065 | 21.8% | 313,093 | 15.0% |
| 2072 | projected | 453,257 | 21.7% | 323,623 | 15.5% |
| 2073 | projected | 450,655 | 21.6% | 333,218 | 15.9% |
| 2074 | projected | 447,865 | 21.4% | 341,857 | 16.3% |
| 2075 | projected | 445,020 | 21.3% | 349,672 | 16.7% |
| 2076 | projected | 442,066 | 21.1% | 356,980 | 17.1% |
| 2077 | projected | 439,061 | 21.0% | 364,053 | 17.4% |
| 2078 | projected | 435,696 | 20.8% | 371,123 | 17.8% |
| 2079 | projected | 432,549 | 20.7% | 378,592 | 18.1% |
| 2080 | projected | 429,370 | 20.6% | 386,450 | 18.5% |
| 2081 | projected | 425,671 | 20.4% | 394,450 | 18.9% |
| 2082 | projected | 422,051 | 20.3% | 402,500 | 19.3% |
| 2083 | projected | 418,292 | 20.1% | 410,301 | 19.7% |
| 2084 | projected | 414,194 | 20.0% | 417,402 | 20.1% |
| 2085 | projected | 410,128 | 19.8% | 423,313 | 20.5% |
| 2086 | projected | 406,492 | 19.7% | 427,742 | 20.7% |
| 2087 | projected | 402,713 | 19.6% | 430,723 | 20.9% |
| 2088 | projected | 398,696 | 19.4% | 432,962 | 21.1% |
| 2089 | projected | 394,776 | 19.3% | 435,016 | 21.3% |
| 2090 | projected | 390,946 | 19.2% | 437,026 | 21.5% |
| 2091 | projected | 387,396 | 19.1% | 439,093 | 21.6% |
| 2092 | projected | 384,129 | 19.0% | 441,223 | 21.8% |
| 2093 | projected | 381,263 | 18.9% | 443,477 | 22.0% |
| 2094 | projected | 378,420 | 18.8% | 445,796 | 22.1% |
| 2095 | projected | 375,404 | 18.7% | 448,153 | 22.3% |
| 2096 | projected | 372,434 | 18.6% | 450,495 | 22.6% |
| 2097 | projected | 369,787 | 18.6% | 452,889 | 22.8% |
| 2098 | projected | 367,411 | 18.5% | 455,275 | 23.0% |
| 2099 | projected | 365,341 | 18.5% | 457,651 | 23.1% |
| 2100 | projected | 363,612 | 18.4% | 460,038 | 23.3% |