Slovakia
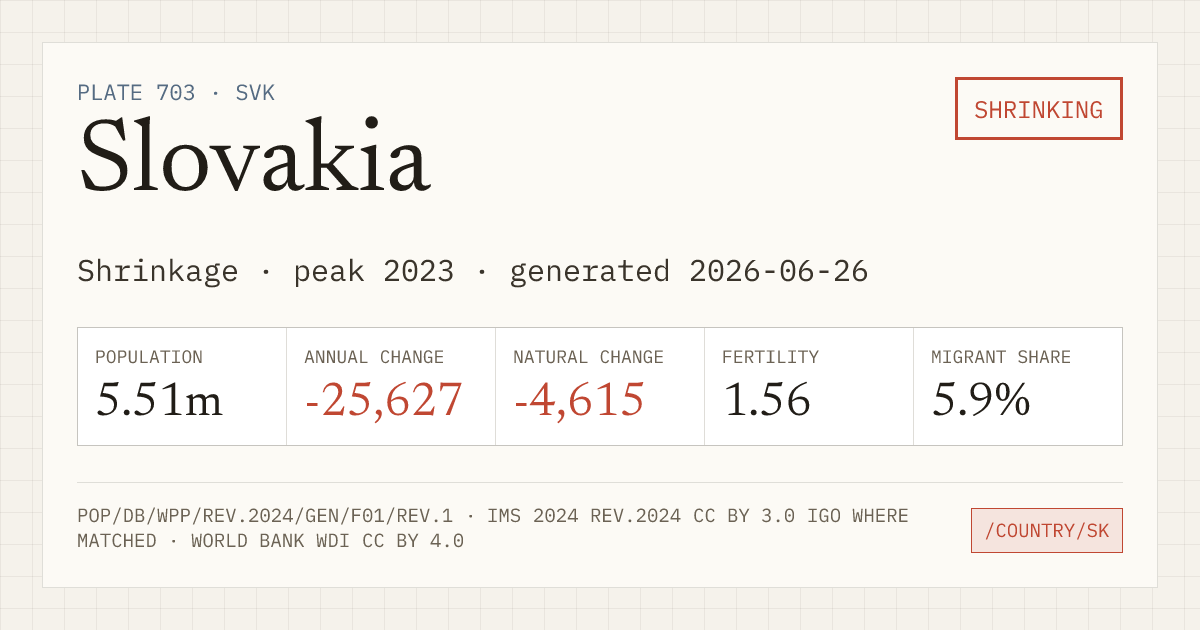
Slovakia's population reached its series maximum in 2023. The current run began in 2024.
- Fertility
- 1.56 83 of 237 with a TFR, lowest first
- World population rank
- 120 of 237
- Regional population rank
- 25 of 50 in Europe
- Population
- 5.51m
- Annual change
- −25,627 22nd-largest annual loss in the record
- Natural change
- −4,615
- Migrant share
- 5.9%
What drives population change?
Births and deaths set natural change. Net migration can reinforce, reduce, or reverse that direction.
Negative net migration adds to natural decline.
Slovakia, 2024 projected: natural change −4,615 people, net migration −21,027, WPP adjustment +15, total population change −25,627. Negative net migration adds to natural decline.
Exact reconciliation: WPP includes a +15-person statistical adjustment. Figures are rounded to whole people.
SOURCE · UN WPP 2024 CHECKS PASSED · DETAILS⌄
Slovakia observed 2023 population pyramid. Mirrored bars compare male and female population from oldest to youngest across 85+, 80–84, 75–79, 70–74, 65–69, 60–64, 55–59, 50–54, 45–49, 40–44, 35–39, 30–34, 25–29, 20–24, 15–19, 10–14, 5–9, 0–4 age bands.
| Year | Population | Annual change | Fertility |
|---|---|---|---|
| 2024 | 5.51m | −25,627 | 1.56 |
| 2050 | 4.94m | −26,932 | 1.60 |
| 2080 | 3.93m | −30,729 | 1.62 |
| 2100 | 3.43m | −22,580 | 1.63 |
Values after 2023 are medium-variant projections, not forecasts.
Youth and older population
Annual share of the population aged under 18 and aged 65+. The crossing shows when the older group first becomes larger in the annual source series.
- First annual crossover
- 2025 · projected
- Rule
- 65+ strictly exceeds under 18
Slovakia annual age balance from 1950 to 2100. Under-18 population moves from 34.1% in 1950 to 18.9% in 2023 and 14.9% in the 2100 projection. Population aged 65 and older moves from 6.6% to 18.1% and 34.7%. First annual crossover: 2025 · projected. Estimates run through 2023 and WPP Medium projections begin in 2024.
- 1950
- Under 18 · 34.1%65+ · 6.6%
- 2023 observed
- Under 18 · 18.9%65+ · 18.1%
- 2100 projected
- Under 18 · 14.9%65+ · 34.7%
Annual evidence · 151 source rows
| Year | Evidence | Under 18 | Share | 65+ | Share |
|---|---|---|---|---|---|
| 1950 | observed | 1,180,807 | 34.1% | 230,029 | 6.6% |
| 1951 | observed | 1,205,339 | 34.2% | 234,706 | 6.7% |
| 1952 | observed | 1,236,378 | 34.4% | 239,292 | 6.7% |
| 1953 | observed | 1,269,853 | 34.7% | 244,013 | 6.7% |
| 1954 | observed | 1,304,552 | 35.0% | 248,172 | 6.7% |
| 1955 | observed | 1,341,437 | 35.3% | 251,899 | 6.6% |
| 1956 | observed | 1,379,124 | 35.7% | 256,274 | 6.6% |
| 1957 | observed | 1,414,316 | 35.9% | 260,543 | 6.6% |
| 1958 | observed | 1,444,215 | 36.1% | 266,400 | 6.7% |
| 1959 | observed | 1,468,924 | 36.1% | 274,351 | 6.7% |
| 1960 | observed | 1,491,803 | 36.2% | 284,012 | 6.9% |
| 1961 | observed | 1,514,761 | 36.2% | 296,184 | 7.1% |
| 1962 | observed | 1,531,253 | 36.2% | 307,761 | 7.3% |
| 1963 | observed | 1,544,990 | 36.1% | 318,998 | 7.5% |
| 1964 | observed | 1,560,488 | 36.1% | 332,290 | 7.7% |
| 1965 | observed | 1,568,243 | 35.9% | 347,201 | 8.0% |
| 1966 | observed | 1,567,510 | 35.6% | 361,720 | 8.2% |
| 1967 | observed | 1,562,508 | 35.2% | 375,993 | 8.5% |
| 1968 | observed | 1,551,338 | 34.7% | 389,814 | 8.7% |
| 1969 | observed | 1,535,470 | 34.2% | 402,229 | 8.9% |
| 1970 | observed | 1,521,702 | 33.6% | 413,576 | 9.1% |
| 1971 | observed | 1,509,591 | 33.1% | 423,899 | 9.3% |
| 1972 | observed | 1,498,994 | 32.6% | 435,577 | 9.5% |
| 1973 | observed | 1,492,678 | 32.1% | 449,103 | 9.7% |
| 1974 | observed | 1,490,876 | 31.8% | 463,363 | 9.9% |
| 1975 | observed | 1,492,610 | 31.5% | 476,479 | 10.1% |
| 1976 | observed | 1,497,863 | 31.3% | 487,492 | 10.2% |
| 1977 | observed | 1,508,123 | 31.2% | 498,124 | 10.3% |
| 1978 | observed | 1,520,379 | 31.1% | 508,429 | 10.4% |
| 1979 | observed | 1,532,681 | 31.1% | 518,435 | 10.5% |
| 1980 | observed | 1,544,217 | 31.0% | 520,693 | 10.5% |
| 1981 | observed | 1,552,513 | 31.0% | 511,637 | 10.2% |
| 1982 | observed | 1,558,564 | 30.9% | 498,067 | 9.9% |
| 1983 | observed | 1,565,780 | 30.8% | 482,750 | 9.5% |
| 1984 | observed | 1,575,147 | 30.8% | 478,029 | 9.3% |
| 1985 | observed | 1,586,757 | 30.8% | 484,367 | 9.4% |
| 1986 | observed | 1,598,719 | 30.9% | 493,789 | 9.5% |
| 1987 | observed | 1,606,420 | 30.9% | 506,806 | 9.7% |
| 1988 | observed | 1,609,574 | 30.8% | 520,273 | 9.9% |
| 1989 | observed | 1,608,276 | 30.6% | 531,744 | 10.1% |
| 1990 | observed | 1,600,611 | 30.4% | 540,328 | 10.3% |
| 1991 | observed | 1,589,932 | 30.1% | 548,208 | 10.4% |
| 1992 | observed | 1,575,452 | 29.7% | 556,068 | 10.5% |
| 1993 | observed | 1,556,178 | 29.2% | 563,862 | 10.6% |
| 1994 | observed | 1,531,918 | 28.7% | 572,107 | 10.7% |
| 1995 | observed | 1,501,018 | 28.0% | 580,329 | 10.8% |
| 1996 | observed | 1,467,003 | 27.4% | 588,356 | 11.0% |
| 1997 | observed | 1,431,426 | 26.7% | 596,233 | 11.1% |
| 1998 | observed | 1,396,246 | 26.0% | 602,021 | 11.2% |
| 1999 | observed | 1,362,156 | 25.3% | 605,982 | 11.3% |
| 2000 | observed | 1,327,046 | 24.7% | 609,488 | 11.3% |
| 2001 | observed | 1,289,563 | 24.0% | 612,535 | 11.4% |
| 2002 | observed | 1,250,846 | 23.3% | 615,770 | 11.5% |
| 2003 | observed | 1,212,946 | 22.6% | 619,545 | 11.5% |
| 2004 | observed | 1,178,250 | 21.9% | 624,356 | 11.6% |
| 2005 | observed | 1,148,220 | 21.4% | 630,464 | 11.7% |
| 2006 | observed | 1,120,445 | 20.8% | 637,344 | 11.9% |
| 2007 | observed | 1,094,586 | 20.4% | 644,503 | 12.0% |
| 2008 | observed | 1,072,054 | 19.9% | 652,060 | 12.1% |
| 2009 | observed | 1,053,726 | 19.6% | 661,590 | 12.3% |
| 2010 | observed | 1,038,863 | 19.3% | 671,165 | 12.4% |
| 2011 | observed | 1,025,345 | 19.0% | 681,539 | 12.6% |
| 2012 | observed | 1,014,233 | 18.8% | 697,762 | 12.9% |
| 2013 | observed | 1,007,351 | 18.6% | 718,737 | 13.3% |
| 2014 | observed | 1,003,274 | 18.5% | 741,616 | 13.7% |
| 2015 | observed | 1,000,627 | 18.5% | 766,905 | 14.1% |
| 2016 | observed | 1,001,195 | 18.4% | 795,773 | 14.7% |
| 2017 | observed | 1,004,814 | 18.5% | 826,226 | 15.2% |
| 2018 | observed | 1,009,476 | 18.5% | 856,053 | 15.7% |
| 2019 | observed | 1,015,971 | 18.6% | 886,232 | 16.3% |
| 2020 | observed | 1,023,047 | 18.8% | 914,483 | 16.8% |
| 2021 | observed | 1,027,799 | 18.9% | 934,240 | 17.2% |
| 2022 | observed | 1,037,508 | 19.0% | 961,672 | 17.6% |
| 2023 | observed | 1,044,335 | 18.9% | 996,055 | 18.1% |
| 2024 | projected | 1,038,535 | 18.9% | 1,020,810 | 18.5% |
| 2025 | projected | 1,027,218 | 18.8% | 1,042,213 | 19.0% |
| 2026 | projected | 1,015,647 | 18.6% | 1,063,418 | 19.5% |
| 2027 | projected | 1,003,958 | 18.5% | 1,083,214 | 19.9% |
| 2028 | projected | 990,627 | 18.2% | 1,102,307 | 20.3% |
| 2029 | projected | 975,525 | 18.0% | 1,122,187 | 20.7% |
| 2030 | projected | 960,218 | 17.8% | 1,140,395 | 21.1% |
| 2031 | projected | 946,853 | 17.6% | 1,155,580 | 21.5% |
| 2032 | projected | 933,140 | 17.4% | 1,167,812 | 21.8% |
| 2033 | projected | 918,514 | 17.2% | 1,177,772 | 22.0% |
| 2034 | projected | 902,338 | 16.9% | 1,188,065 | 22.3% |
| 2035 | projected | 884,929 | 16.7% | 1,199,492 | 22.6% |
| 2036 | projected | 867,685 | 16.4% | 1,211,640 | 22.9% |
| 2037 | projected | 851,573 | 16.2% | 1,226,007 | 23.3% |
| 2038 | projected | 837,106 | 16.0% | 1,243,758 | 23.7% |
| 2039 | projected | 823,622 | 15.8% | 1,264,936 | 24.3% |
| 2040 | projected | 812,280 | 15.6% | 1,287,440 | 24.8% |
| 2041 | projected | 803,806 | 15.6% | 1,310,134 | 25.4% |
| 2042 | projected | 796,919 | 15.5% | 1,333,228 | 25.9% |
| 2043 | projected | 791,310 | 15.5% | 1,356,088 | 26.5% |
| 2044 | projected | 786,751 | 15.4% | 1,378,895 | 27.1% |
| 2045 | projected | 783,235 | 15.5% | 1,399,665 | 27.6% |
| 2046 | projected | 780,627 | 15.5% | 1,417,705 | 28.1% |
| 2047 | projected | 778,720 | 15.5% | 1,434,912 | 28.6% |
| 2048 | projected | 777,350 | 15.6% | 1,451,685 | 29.1% |
| 2049 | projected | 776,305 | 15.6% | 1,468,045 | 29.6% |
| 2050 | projected | 775,342 | 15.7% | 1,484,171 | 30.1% |
| 2051 | projected | 774,235 | 15.8% | 1,498,933 | 30.5% |
| 2052 | projected | 772,793 | 15.8% | 1,511,298 | 31.0% |
| 2053 | projected | 770,882 | 15.9% | 1,522,210 | 31.4% |
| 2054 | projected | 768,400 | 15.9% | 1,531,533 | 31.7% |
| 2055 | projected | 765,142 | 16.0% | 1,539,556 | 32.1% |
| 2056 | projected | 760,975 | 16.0% | 1,546,757 | 32.5% |
| 2057 | projected | 755,903 | 16.0% | 1,551,576 | 32.8% |
| 2058 | projected | 749,964 | 16.0% | 1,553,953 | 33.1% |
| 2059 | projected | 743,192 | 15.9% | 1,552,468 | 33.3% |
| 2060 | projected | 735,667 | 15.9% | 1,545,449 | 33.3% |
| 2061 | projected | 727,488 | 15.8% | 1,535,241 | 33.4% |
| 2062 | projected | 718,720 | 15.7% | 1,523,553 | 33.4% |
| 2063 | projected | 709,462 | 15.7% | 1,510,229 | 33.3% |
| 2064 | projected | 699,924 | 15.6% | 1,495,427 | 33.3% |
| 2065 | projected | 690,282 | 15.5% | 1,479,543 | 33.2% |
| 2066 | projected | 680,701 | 15.4% | 1,461,516 | 33.1% |
| 2067 | projected | 671,270 | 15.3% | 1,441,424 | 32.9% |
| 2068 | projected | 662,112 | 15.2% | 1,421,288 | 32.7% |
| 2069 | projected | 653,388 | 15.2% | 1,402,659 | 32.6% |
| 2070 | projected | 645,232 | 15.1% | 1,385,531 | 32.4% |
| 2071 | projected | 637,679 | 15.1% | 1,368,761 | 32.3% |
| 2072 | projected | 630,758 | 15.0% | 1,352,515 | 32.2% |
| 2073 | projected | 624,560 | 15.0% | 1,338,306 | 32.2% |
| 2074 | projected | 619,139 | 15.0% | 1,327,303 | 32.2% |
| 2075 | projected | 614,398 | 15.0% | 1,317,632 | 32.2% |
| 2076 | projected | 610,294 | 15.0% | 1,309,562 | 32.3% |
| 2077 | projected | 606,757 | 15.1% | 1,301,769 | 32.4% |
| 2078 | projected | 603,703 | 15.1% | 1,292,461 | 32.4% |
| 2079 | projected | 600,978 | 15.2% | 1,284,007 | 32.4% |
| 2080 | projected | 598,502 | 15.2% | 1,277,086 | 32.5% |
| 2081 | projected | 596,185 | 15.3% | 1,272,432 | 32.7% |
| 2082 | projected | 593,912 | 15.4% | 1,269,804 | 32.8% |
| 2083 | projected | 591,554 | 15.4% | 1,267,985 | 33.0% |
| 2084 | projected | 589,026 | 15.5% | 1,266,246 | 33.2% |
| 2085 | projected | 586,291 | 15.5% | 1,264,179 | 33.4% |
| 2086 | projected | 583,275 | 15.5% | 1,262,405 | 33.6% |
| 2087 | projected | 579,946 | 15.5% | 1,259,781 | 33.8% |
| 2088 | projected | 576,251 | 15.6% | 1,255,578 | 33.9% |
| 2089 | projected | 572,143 | 15.5% | 1,251,039 | 34.0% |
| 2090 | projected | 567,643 | 15.5% | 1,246,305 | 34.1% |
| 2091 | projected | 562,782 | 15.5% | 1,241,433 | 34.2% |
| 2092 | projected | 557,554 | 15.4% | 1,236,360 | 34.3% |
| 2093 | projected | 552,034 | 15.4% | 1,231,048 | 34.3% |
| 2094 | projected | 546,269 | 15.3% | 1,225,520 | 34.4% |
| 2095 | projected | 540,319 | 15.3% | 1,219,738 | 34.5% |
| 2096 | projected | 534,285 | 15.2% | 1,213,729 | 34.5% |
| 2097 | projected | 528,235 | 15.1% | 1,207,539 | 34.6% |
| 2098 | projected | 522,199 | 15.0% | 1,201,253 | 34.6% |
| 2099 | projected | 516,260 | 15.0% | 1,194,879 | 34.6% |
| 2100 | projected | 510,483 | 14.9% | 1,188,419 | 34.7% |