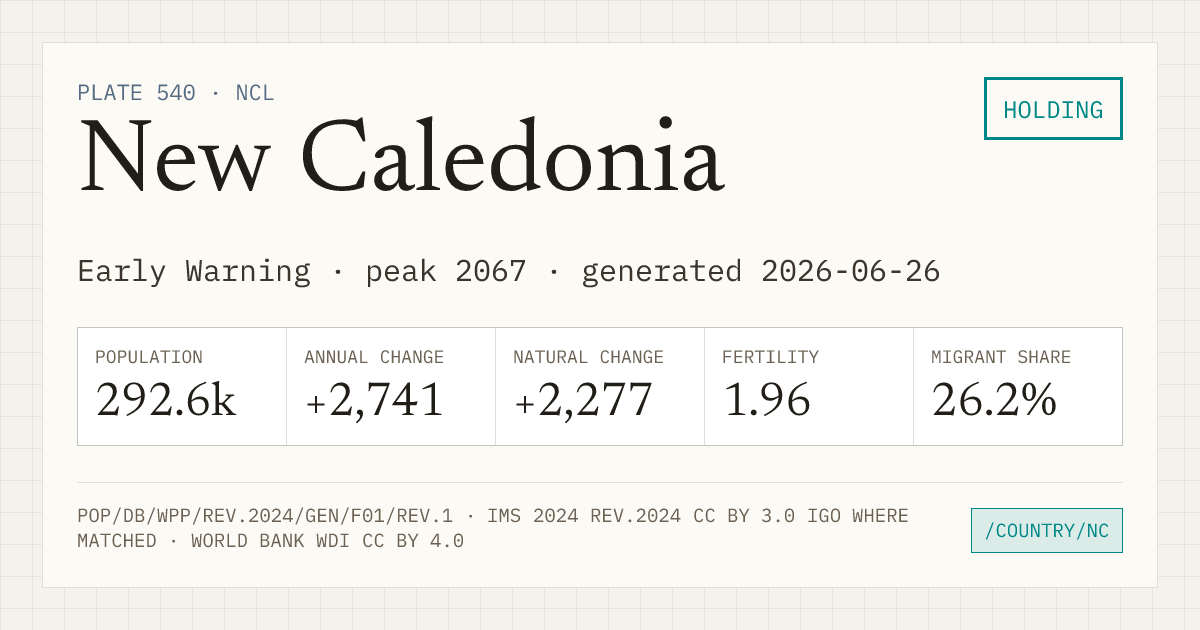
New Caledonia
- Fertility
- 1.96 123 of 237 with a TFR, lowest first
- World population rank
- 185 of 237
- Regional population rank
- 7 of 23 in Oceania
- Population
- 292,639
- Annual change
- +2,741
- Natural change
- +2,277
- Migrant share
- 26.2%
What drives population change?
Births and deaths set natural change. Net migration can reinforce, reduce, or reverse that direction.
Positive net migration adds to natural growth.
New Caledonia, 2024 projected: natural change +2,277 people, net migration +455, WPP adjustment +9, total population change +2,741. Positive net migration adds to natural growth.
Exact reconciliation: WPP includes a +9-person statistical adjustment. Figures are rounded to whole people.
SOURCE · UN WPP 2024 CHECKS PASSED · DETAILS⌄
Growth in this series
- Current run
- Since 2019 6 consecutive years · projected 2024
- Latest annual gain
- +2,741 0.94% of 2024 population
- Series maximum
- projected 2067 Projected from the WPP medium variant, not a forecast.
New Caledonia observed 2023 population pyramid. Mirrored bars compare male and female population from oldest to youngest across 85+, 80–84, 75–79, 70–74, 65–69, 60–64, 55–59, 50–54, 45–49, 40–44, 35–39, 30–34, 25–29, 20–24, 15–19, 10–14, 5–9, 0–4 age bands.
| Year | Population | Annual change | Fertility |
|---|---|---|---|
| 2024 | 292,639 | +2,741 | 1.96 |
| 2050 | 340,580 | +889 | 1.77 |
| 2080 | 346,183 | −123 | 1.72 |
| 2100 | 337,221 | −704 | 1.71 |
Values after 2023 are medium-variant projections, not forecasts.
Youth and older population
Annual share of the population aged under 18 and aged 65+. The crossing shows when the older group first becomes larger in the annual source series.
- First annual crossover
- 2048 · projected
- Rule
- 65+ strictly exceeds under 18
New Caledonia annual age balance from 1950 to 2100. Under-18 population moves from 41.6% in 1950 to 26.0% in 2023 and 17.1% in the 2100 projection. Population aged 65 and older moves from 5.0% to 11.1% and 30.2%. First annual crossover: 2048 · projected. Estimates run through 2023 and WPP Medium projections begin in 2024.
- 1950
- Under 18 · 41.6%65+ · 5.0%
- 2023 observed
- Under 18 · 26.0%65+ · 11.1%
- 2100 projected
- Under 18 · 17.1%65+ · 30.2%
Annual evidence · 151 source rows
| Year | Evidence | Under 18 | Share | 65+ | Share |
|---|---|---|---|---|---|
| 1950 | observed | 26,546 | 41.6% | 3,180 | 5.0% |
| 1951 | observed | 27,112 | 41.9% | 3,059 | 4.7% |
| 1952 | observed | 27,711 | 42.2% | 2,959 | 4.5% |
| 1953 | observed | 28,342 | 42.4% | 2,858 | 4.3% |
| 1954 | observed | 29,005 | 42.7% | 2,772 | 4.1% |
| 1955 | observed | 29,707 | 43.0% | 2,703 | 3.9% |
| 1956 | observed | 30,513 | 43.2% | 2,659 | 3.8% |
| 1957 | observed | 31,491 | 43.4% | 2,663 | 3.7% |
| 1958 | observed | 32,603 | 43.6% | 2,672 | 3.6% |
| 1959 | observed | 33,788 | 43.7% | 2,698 | 3.5% |
| 1960 | observed | 35,065 | 43.9% | 2,730 | 3.4% |
| 1961 | observed | 36,439 | 44.2% | 2,784 | 3.4% |
| 1962 | observed | 37,864 | 44.4% | 2,836 | 3.3% |
| 1963 | observed | 39,250 | 44.6% | 2,901 | 3.3% |
| 1964 | observed | 40,583 | 44.8% | 2,980 | 3.3% |
| 1965 | observed | 41,885 | 45.0% | 3,045 | 3.3% |
| 1966 | observed | 43,215 | 45.1% | 3,125 | 3.3% |
| 1967 | observed | 44,585 | 45.2% | 3,215 | 3.3% |
| 1968 | observed | 45,977 | 45.3% | 3,312 | 3.3% |
| 1969 | observed | 47,559 | 45.4% | 3,391 | 3.2% |
| 1970 | observed | 49,754 | 45.5% | 3,532 | 3.2% |
| 1971 | observed | 52,436 | 45.8% | 3,755 | 3.3% |
| 1972 | observed | 55,248 | 46.1% | 3,996 | 3.3% |
| 1973 | observed | 58,156 | 46.3% | 4,270 | 3.4% |
| 1974 | observed | 61,101 | 46.5% | 4,564 | 3.5% |
| 1975 | observed | 63,964 | 46.5% | 4,889 | 3.6% |
| 1976 | observed | 65,936 | 46.4% | 5,170 | 3.6% |
| 1977 | observed | 66,707 | 46.1% | 5,389 | 3.7% |
| 1978 | observed | 67,065 | 45.8% | 5,578 | 3.8% |
| 1979 | observed | 67,400 | 45.5% | 5,743 | 3.9% |
| 1980 | observed | 67,694 | 45.2% | 5,890 | 3.9% |
| 1981 | observed | 67,899 | 44.8% | 6,007 | 4.0% |
| 1982 | observed | 68,009 | 44.4% | 6,110 | 4.0% |
| 1983 | observed | 68,170 | 44.0% | 6,219 | 4.0% |
| 1984 | observed | 68,321 | 43.4% | 6,392 | 4.1% |
| 1985 | observed | 68,263 | 42.6% | 6,603 | 4.1% |
| 1986 | observed | 68,140 | 41.8% | 6,826 | 4.2% |
| 1987 | observed | 68,047 | 41.1% | 7,061 | 4.3% |
| 1988 | observed | 67,989 | 40.4% | 7,323 | 4.3% |
| 1989 | observed | 68,857 | 40.0% | 7,406 | 4.3% |
| 1990 | observed | 70,061 | 39.7% | 7,508 | 4.3% |
| 1991 | observed | 70,746 | 39.0% | 7,821 | 4.3% |
| 1992 | observed | 71,474 | 38.4% | 8,160 | 4.4% |
| 1993 | observed | 72,169 | 37.8% | 8,524 | 4.5% |
| 1994 | observed | 72,846 | 37.2% | 8,924 | 4.6% |
| 1995 | observed | 73,516 | 36.7% | 9,357 | 4.7% |
| 1996 | observed | 74,212 | 36.2% | 9,806 | 4.8% |
| 1997 | observed | 75,107 | 35.8% | 10,289 | 4.9% |
| 1998 | observed | 76,132 | 35.6% | 10,832 | 5.1% |
| 1999 | observed | 77,129 | 35.3% | 11,395 | 5.2% |
| 2000 | observed | 78,208 | 35.1% | 11,985 | 5.4% |
| 2001 | observed | 79,292 | 34.8% | 12,609 | 5.5% |
| 2002 | observed | 80,311 | 34.6% | 13,282 | 5.7% |
| 2003 | observed | 81,295 | 34.3% | 14,001 | 5.9% |
| 2004 | observed | 82,039 | 34.1% | 14,732 | 6.1% |
| 2005 | observed | 82,342 | 33.7% | 15,418 | 6.3% |
| 2006 | observed | 82,076 | 33.2% | 16,175 | 6.5% |
| 2007 | observed | 81,613 | 32.6% | 17,109 | 6.8% |
| 2008 | observed | 81,285 | 32.0% | 18,103 | 7.1% |
| 2009 | observed | 81,079 | 31.5% | 19,103 | 7.4% |
| 2010 | observed | 81,201 | 31.0% | 20,014 | 7.7% |
| 2011 | observed | 81,626 | 30.6% | 20,897 | 7.8% |
| 2012 | observed | 82,194 | 30.3% | 21,843 | 8.0% |
| 2013 | observed | 82,838 | 29.9% | 22,881 | 8.3% |
| 2014 | observed | 83,134 | 29.6% | 23,949 | 8.5% |
| 2015 | observed | 82,408 | 29.1% | 24,908 | 8.8% |
| 2016 | observed | 81,124 | 28.6% | 25,771 | 9.1% |
| 2017 | observed | 79,935 | 28.2% | 26,608 | 9.4% |
| 2018 | observed | 78,657 | 27.7% | 27,452 | 9.7% |
| 2019 | observed | 77,322 | 27.3% | 28,337 | 10.0% |
| 2020 | observed | 76,345 | 26.9% | 29,140 | 10.3% |
| 2021 | observed | 75,681 | 26.5% | 29,972 | 10.5% |
| 2022 | observed | 75,303 | 26.2% | 30,987 | 10.8% |
| 2023 | observed | 75,223 | 26.0% | 32,144 | 11.1% |
| 2024 | projected | 75,099 | 25.7% | 33,432 | 11.4% |
| 2025 | projected | 74,949 | 25.4% | 34,783 | 11.8% |
| 2026 | projected | 74,800 | 25.1% | 36,190 | 12.1% |
| 2027 | projected | 74,662 | 24.9% | 37,690 | 12.5% |
| 2028 | projected | 74,500 | 24.6% | 39,295 | 13.0% |
| 2029 | projected | 74,345 | 24.4% | 40,899 | 13.4% |
| 2030 | projected | 74,149 | 24.1% | 42,482 | 13.8% |
| 2031 | projected | 73,909 | 23.9% | 44,138 | 14.2% |
| 2032 | projected | 73,666 | 23.6% | 45,887 | 14.7% |
| 2033 | projected | 73,505 | 23.4% | 47,653 | 15.2% |
| 2034 | projected | 73,355 | 23.2% | 49,467 | 15.6% |
| 2035 | projected | 73,165 | 23.0% | 51,346 | 16.1% |
| 2036 | projected | 72,998 | 22.8% | 53,230 | 16.6% |
| 2037 | projected | 72,780 | 22.6% | 55,132 | 17.1% |
| 2038 | projected | 72,535 | 22.4% | 56,999 | 17.6% |
| 2039 | projected | 72,280 | 22.2% | 58,783 | 18.0% |
| 2040 | projected | 72,015 | 22.0% | 60,412 | 18.4% |
| 2041 | projected | 71,763 | 21.8% | 61,858 | 18.8% |
| 2042 | projected | 71,546 | 21.6% | 63,261 | 19.1% |
| 2043 | projected | 71,364 | 21.5% | 64,625 | 19.4% |
| 2044 | projected | 71,193 | 21.3% | 65,914 | 19.7% |
| 2045 | projected | 71,036 | 21.2% | 67,210 | 20.1% |
| 2046 | projected | 70,892 | 21.1% | 68,556 | 20.4% |
| 2047 | projected | 70,724 | 20.9% | 69,895 | 20.7% |
| 2048 | projected | 70,546 | 20.8% | 71,178 | 21.0% |
| 2049 | projected | 70,377 | 20.7% | 72,384 | 21.3% |
| 2050 | projected | 70,210 | 20.6% | 73,578 | 21.6% |
| 2051 | projected | 70,020 | 20.5% | 74,804 | 21.9% |
| 2052 | projected | 69,819 | 20.4% | 75,990 | 22.2% |
| 2053 | projected | 69,627 | 20.3% | 77,080 | 22.5% |
| 2054 | projected | 69,405 | 20.2% | 78,121 | 22.7% |
| 2055 | projected | 69,170 | 20.1% | 79,134 | 23.0% |
| 2056 | projected | 68,921 | 20.0% | 80,080 | 23.2% |
| 2057 | projected | 68,662 | 19.9% | 80,916 | 23.4% |
| 2058 | projected | 68,414 | 19.8% | 81,654 | 23.6% |
| 2059 | projected | 68,155 | 19.7% | 82,230 | 23.8% |
| 2060 | projected | 67,865 | 19.6% | 82,632 | 23.9% |
| 2061 | projected | 67,580 | 19.5% | 82,943 | 23.9% |
| 2062 | projected | 67,288 | 19.4% | 83,222 | 24.0% |
| 2063 | projected | 67,004 | 19.3% | 83,526 | 24.1% |
| 2064 | projected | 66,732 | 19.2% | 83,925 | 24.2% |
| 2065 | projected | 66,462 | 19.1% | 84,518 | 24.3% |
| 2066 | projected | 66,191 | 19.0% | 85,263 | 24.5% |
| 2067 | projected | 65,903 | 19.0% | 85,971 | 24.7% |
| 2068 | projected | 65,609 | 18.9% | 86,642 | 24.9% |
| 2069 | projected | 65,316 | 18.8% | 87,323 | 25.1% |
| 2070 | projected | 65,032 | 18.7% | 87,982 | 25.3% |
| 2071 | projected | 64,759 | 18.6% | 88,656 | 25.5% |
| 2072 | projected | 64,496 | 18.6% | 89,338 | 25.7% |
| 2073 | projected | 64,247 | 18.5% | 89,956 | 25.9% |
| 2074 | projected | 64,020 | 18.4% | 90,530 | 26.1% |
| 2075 | projected | 63,789 | 18.4% | 91,102 | 26.2% |
| 2076 | projected | 63,562 | 18.3% | 91,657 | 26.4% |
| 2077 | projected | 63,341 | 18.3% | 92,213 | 26.6% |
| 2078 | projected | 63,104 | 18.2% | 92,774 | 26.8% |
| 2079 | projected | 62,859 | 18.1% | 93,340 | 26.9% |
| 2080 | projected | 62,643 | 18.1% | 93,840 | 27.1% |
| 2081 | projected | 62,439 | 18.0% | 94,295 | 27.3% |
| 2082 | projected | 62,226 | 18.0% | 94,791 | 27.4% |
| 2083 | projected | 62,023 | 17.9% | 95,270 | 27.6% |
| 2084 | projected | 61,803 | 17.9% | 95,807 | 27.7% |
| 2085 | projected | 61,576 | 17.8% | 96,373 | 27.9% |
| 2086 | projected | 61,340 | 17.8% | 96,919 | 28.1% |
| 2087 | projected | 61,100 | 17.7% | 97,450 | 28.3% |
| 2088 | projected | 60,850 | 17.7% | 97,944 | 28.5% |
| 2089 | projected | 60,611 | 17.7% | 98,423 | 28.7% |
| 2090 | projected | 60,362 | 17.6% | 98,864 | 28.8% |
| 2091 | projected | 60,103 | 17.6% | 99,261 | 29.0% |
| 2092 | projected | 59,843 | 17.5% | 99,619 | 29.1% |
| 2093 | projected | 59,586 | 17.4% | 99,964 | 29.3% |
| 2094 | projected | 59,312 | 17.4% | 100,269 | 29.4% |
| 2095 | projected | 59,041 | 17.3% | 100,543 | 29.5% |
| 2096 | projected | 58,768 | 17.3% | 100,797 | 29.7% |
| 2097 | projected | 58,484 | 17.2% | 101,042 | 29.8% |
| 2098 | projected | 58,202 | 17.2% | 101,263 | 29.9% |
| 2099 | projected | 57,936 | 17.1% | 101,478 | 30.0% |
| 2100 | projected | 57,664 | 17.1% | 101,674 | 30.2% |