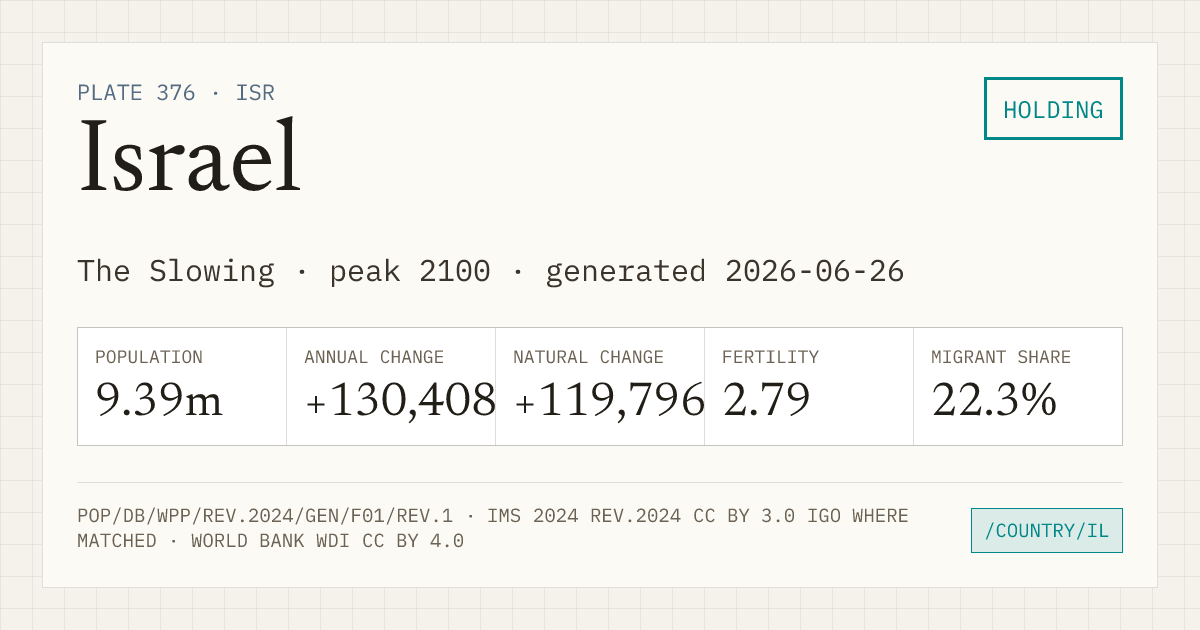
Israel
- Fertility
- 2.79 177 of 237 with a TFR, lowest first
- World population rank
- 98 of 237
- Regional population rank
- 31 of 51 in Asia
- Population
- 9.39m
- Annual change
- +130,408
- Natural change
- +119,796
- Migrant share
- 22.3%
What drives population change?
Births and deaths set natural change. Net migration can reinforce, reduce, or reverse that direction.
Positive net migration adds to natural growth.
Israel, 2024 projected: natural change +119,796 people, net migration +10,612, WPP adjustment 0, total population change +130,408. Positive net migration adds to natural growth.
Exact reconciliation: WPP includes a 0-person statistical adjustment. Figures are rounded to whole people.
SOURCE · UN WPP 2024 CHECKS PASSED · DETAILS⌄
Growth in this series
- Current run
- Since 1950 75 consecutive years · projected 2024
- Latest annual gain
- +130,408 1.39% of 2024 population
- Series maximum
- not established in this series Still rising at the 2100 horizon of this release.
Israel observed 2023 population pyramid. Mirrored bars compare male and female population from oldest to youngest across 85+, 80–84, 75–79, 70–74, 65–69, 60–64, 55–59, 50–54, 45–49, 40–44, 35–39, 30–34, 25–29, 20–24, 15–19, 10–14, 5–9, 0–4 age bands.
| Year | Population | Annual change | Fertility |
|---|---|---|---|
| 2024 | 9.39m | +130,408 | 2.79 |
| 2050 | 13.09m | +152,596 | 2.31 |
| 2080 | 17.37m | +144,763 | 2.02 |
| 2100 | 19.75m | +94,242 | 1.91 |
Values after 2023 are medium-variant projections, not forecasts.
Youth and older population
Annual share of the population aged under 18 and aged 65+. The crossing shows when the older group first becomes larger in the annual source series.
- First annual crossover
- 2091 · projected
- Rule
- 65+ strictly exceeds under 18
Israel annual age balance from 1950 to 2100. Under-18 population moves from 37.2% in 1950 to 32.4% in 2023 and 20.9% in the 2100 projection. Population aged 65 and older moves from 4.0% to 12.4% and 23.9%. First annual crossover: 2091 · projected. Estimates run through 2023 and WPP Medium projections begin in 2024.
- 1950
- Under 18 · 37.2%65+ · 4.0%
- 2023 observed
- Under 18 · 32.4%65+ · 12.4%
- 2100 projected
- Under 18 · 20.9%65+ · 23.9%
Annual evidence · 151 source rows
| Year | Evidence | Under 18 | Share | 65+ | Share |
|---|---|---|---|---|---|
| 1950 | observed | 479,457 | 37.2% | 51,117 | 4.0% |
| 1951 | observed | 511,448 | 37.8% | 54,427 | 4.0% |
| 1952 | observed | 543,312 | 38.4% | 57,759 | 4.1% |
| 1953 | observed | 574,669 | 38.9% | 61,157 | 4.1% |
| 1954 | observed | 605,137 | 39.3% | 64,700 | 4.2% |
| 1955 | observed | 634,657 | 39.7% | 68,527 | 4.3% |
| 1956 | observed | 663,156 | 39.9% | 72,761 | 4.4% |
| 1957 | observed | 690,155 | 40.1% | 77,266 | 4.5% |
| 1958 | observed | 715,170 | 40.2% | 82,224 | 4.6% |
| 1959 | observed | 737,839 | 40.2% | 88,064 | 4.8% |
| 1960 | observed | 757,202 | 40.0% | 95,031 | 5.0% |
| 1961 | observed | 783,232 | 40.0% | 102,381 | 5.2% |
| 1962 | observed | 824,414 | 40.4% | 109,394 | 5.4% |
| 1963 | observed | 871,085 | 40.8% | 116,690 | 5.5% |
| 1964 | observed | 915,489 | 41.0% | 124,684 | 5.6% |
| 1965 | observed | 957,092 | 41.1% | 133,430 | 5.7% |
| 1966 | observed | 995,955 | 40.9% | 142,921 | 5.9% |
| 1967 | observed | 1,032,453 | 40.7% | 152,984 | 6.0% |
| 1968 | observed | 1,067,045 | 40.3% | 163,606 | 6.2% |
| 1969 | observed | 1,100,247 | 39.9% | 175,062 | 6.4% |
| 1970 | observed | 1,132,524 | 39.5% | 187,676 | 6.6% |
| 1971 | observed | 1,164,025 | 39.1% | 201,717 | 6.8% |
| 1972 | observed | 1,192,590 | 38.7% | 215,892 | 7.0% |
| 1973 | observed | 1,218,086 | 38.5% | 229,082 | 7.2% |
| 1974 | observed | 1,243,908 | 38.4% | 242,133 | 7.5% |
| 1975 | observed | 1,271,789 | 38.3% | 256,243 | 7.7% |
| 1976 | observed | 1,302,087 | 38.3% | 270,513 | 8.0% |
| 1977 | observed | 1,333,435 | 38.3% | 284,826 | 8.2% |
| 1978 | observed | 1,363,488 | 38.3% | 299,367 | 8.4% |
| 1979 | observed | 1,393,126 | 38.3% | 314,205 | 8.6% |
| 1980 | observed | 1,423,223 | 38.2% | 328,296 | 8.8% |
| 1981 | observed | 1,451,588 | 38.2% | 339,461 | 8.9% |
| 1982 | observed | 1,478,097 | 38.1% | 347,947 | 9.0% |
| 1983 | observed | 1,502,827 | 38.0% | 353,639 | 8.9% |
| 1984 | observed | 1,529,647 | 37.9% | 358,088 | 8.9% |
| 1985 | observed | 1,557,462 | 37.9% | 365,912 | 8.9% |
| 1986 | observed | 1,580,621 | 37.9% | 374,171 | 9.0% |
| 1987 | observed | 1,601,820 | 37.8% | 381,853 | 9.0% |
| 1988 | observed | 1,621,903 | 37.7% | 390,589 | 9.1% |
| 1989 | observed | 1,640,397 | 37.4% | 399,990 | 9.1% |
| 1990 | observed | 1,683,583 | 37.0% | 419,999 | 9.2% |
| 1991 | observed | 1,747,046 | 36.5% | 447,341 | 9.4% |
| 1992 | observed | 1,791,267 | 36.1% | 468,032 | 9.4% |
| 1993 | observed | 1,818,716 | 35.8% | 484,001 | 9.5% |
| 1994 | observed | 1,845,410 | 35.4% | 499,262 | 9.6% |
| 1995 | observed | 1,874,135 | 35.0% | 519,397 | 9.7% |
| 1996 | observed | 1,905,304 | 34.6% | 538,998 | 9.8% |
| 1997 | observed | 1,938,625 | 34.3% | 553,143 | 9.8% |
| 1998 | observed | 1,973,341 | 34.1% | 566,416 | 9.8% |
| 1999 | observed | 2,012,008 | 33.8% | 579,299 | 9.7% |
| 2000 | observed | 2,052,050 | 33.6% | 594,266 | 9.7% |
| 2001 | observed | 2,086,300 | 33.3% | 610,192 | 9.7% |
| 2002 | observed | 2,115,353 | 33.1% | 627,145 | 9.8% |
| 2003 | observed | 2,144,741 | 33.0% | 643,459 | 9.9% |
| 2004 | observed | 2,175,563 | 32.9% | 657,359 | 9.9% |
| 2005 | observed | 2,206,781 | 32.8% | 669,553 | 10.0% |
| 2006 | observed | 2,239,747 | 32.7% | 680,456 | 9.9% |
| 2007 | observed | 2,275,276 | 32.7% | 688,985 | 9.9% |
| 2008 | observed | 2,312,761 | 32.7% | 696,806 | 9.8% |
| 2009 | observed | 2,353,709 | 32.7% | 708,442 | 9.8% |
| 2010 | observed | 2,399,777 | 32.7% | 726,174 | 9.9% |
| 2011 | observed | 2,447,790 | 32.8% | 752,608 | 10.1% |
| 2012 | observed | 2,497,776 | 32.8% | 786,811 | 10.3% |
| 2013 | observed | 2,550,619 | 32.9% | 820,655 | 10.6% |
| 2014 | observed | 2,604,297 | 33.0% | 852,522 | 10.8% |
| 2015 | observed | 2,659,251 | 33.0% | 887,254 | 11.0% |
| 2016 | observed | 2,712,513 | 33.0% | 924,563 | 11.3% |
| 2017 | observed | 2,762,546 | 33.0% | 960,976 | 11.5% |
| 2018 | observed | 2,809,565 | 33.0% | 995,788 | 11.7% |
| 2019 | observed | 2,853,219 | 33.0% | 1,028,985 | 11.9% |
| 2020 | observed | 2,892,063 | 32.9% | 1,060,697 | 12.1% |
| 2021 | observed | 2,928,001 | 32.7% | 1,090,855 | 12.2% |
| 2022 | observed | 2,966,052 | 32.6% | 1,119,965 | 12.3% |
| 2023 | observed | 3,000,756 | 32.4% | 1,149,235 | 12.4% |
| 2024 | projected | 3,029,310 | 32.3% | 1,178,328 | 12.6% |
| 2025 | projected | 3,054,967 | 32.1% | 1,207,886 | 12.7% |
| 2026 | projected | 3,077,324 | 31.9% | 1,236,394 | 12.8% |
| 2027 | projected | 3,095,795 | 31.7% | 1,263,109 | 12.9% |
| 2028 | projected | 3,110,497 | 31.4% | 1,289,245 | 13.0% |
| 2029 | projected | 3,124,056 | 31.1% | 1,315,697 | 13.1% |
| 2030 | projected | 3,137,251 | 30.8% | 1,343,163 | 13.2% |
| 2031 | projected | 3,150,721 | 30.6% | 1,370,936 | 13.3% |
| 2032 | projected | 3,163,628 | 30.3% | 1,397,278 | 13.4% |
| 2033 | projected | 3,174,971 | 30.0% | 1,424,223 | 13.5% |
| 2034 | projected | 3,186,948 | 29.7% | 1,454,396 | 13.6% |
| 2035 | projected | 3,199,621 | 29.5% | 1,487,336 | 13.7% |
| 2036 | projected | 3,212,850 | 29.2% | 1,523,137 | 13.9% |
| 2037 | projected | 3,229,462 | 29.0% | 1,559,583 | 14.0% |
| 2038 | projected | 3,252,074 | 28.8% | 1,596,009 | 14.1% |
| 2039 | projected | 3,275,878 | 28.7% | 1,634,033 | 14.3% |
| 2040 | projected | 3,299,824 | 28.5% | 1,674,155 | 14.5% |
| 2041 | projected | 3,328,659 | 28.4% | 1,715,791 | 14.6% |
| 2042 | projected | 3,361,874 | 28.3% | 1,756,139 | 14.8% |
| 2043 | projected | 3,397,372 | 28.2% | 1,793,226 | 14.9% |
| 2044 | projected | 3,434,125 | 28.2% | 1,830,083 | 15.0% |
| 2045 | projected | 3,470,953 | 28.1% | 1,868,085 | 15.1% |
| 2046 | projected | 3,507,518 | 28.1% | 1,905,485 | 15.3% |
| 2047 | projected | 3,543,608 | 28.0% | 1,942,865 | 15.4% |
| 2048 | projected | 3,578,499 | 28.0% | 1,981,542 | 15.5% |
| 2049 | projected | 3,612,460 | 27.9% | 2,020,576 | 15.6% |
| 2050 | projected | 3,644,900 | 27.8% | 2,058,650 | 15.7% |
| 2051 | projected | 3,675,124 | 27.7% | 2,095,918 | 15.8% |
| 2052 | projected | 3,703,342 | 27.6% | 2,132,229 | 15.9% |
| 2053 | projected | 3,729,527 | 27.5% | 2,167,956 | 16.0% |
| 2054 | projected | 3,753,830 | 27.4% | 2,203,940 | 16.1% |
| 2055 | projected | 3,775,776 | 27.2% | 2,239,764 | 16.2% |
| 2056 | projected | 3,794,378 | 27.1% | 2,275,071 | 16.2% |
| 2057 | projected | 3,809,916 | 26.9% | 2,309,806 | 16.3% |
| 2058 | projected | 3,822,894 | 26.7% | 2,343,753 | 16.4% |
| 2059 | projected | 3,833,314 | 26.5% | 2,376,820 | 16.4% |
| 2060 | projected | 3,842,387 | 26.3% | 2,408,858 | 16.5% |
| 2061 | projected | 3,850,028 | 26.1% | 2,441,163 | 16.6% |
| 2062 | projected | 3,855,861 | 25.9% | 2,474,650 | 16.6% |
| 2063 | projected | 3,861,610 | 25.7% | 2,509,773 | 16.7% |
| 2064 | projected | 3,866,677 | 25.5% | 2,545,728 | 16.8% |
| 2065 | projected | 3,871,335 | 25.3% | 2,583,195 | 16.9% |
| 2066 | projected | 3,876,394 | 25.1% | 2,622,650 | 17.0% |
| 2067 | projected | 3,881,847 | 24.9% | 2,663,936 | 17.1% |
| 2068 | projected | 3,888,275 | 24.7% | 2,709,871 | 17.2% |
| 2069 | projected | 3,896,067 | 24.6% | 2,758,731 | 17.4% |
| 2070 | projected | 3,905,439 | 24.4% | 2,807,674 | 17.5% |
| 2071 | projected | 3,915,598 | 24.3% | 2,858,477 | 17.7% |
| 2072 | projected | 3,925,217 | 24.1% | 2,912,123 | 17.9% |
| 2073 | projected | 3,935,142 | 24.0% | 2,968,427 | 18.1% |
| 2074 | projected | 3,946,997 | 23.9% | 3,028,619 | 18.3% |
| 2075 | projected | 3,960,455 | 23.8% | 3,092,738 | 18.6% |
| 2076 | projected | 3,974,803 | 23.7% | 3,158,319 | 18.8% |
| 2077 | projected | 3,990,661 | 23.6% | 3,225,392 | 19.0% |
| 2078 | projected | 4,007,879 | 23.5% | 3,294,104 | 19.3% |
| 2079 | projected | 4,024,820 | 23.4% | 3,364,431 | 19.5% |
| 2080 | projected | 4,042,024 | 23.3% | 3,437,107 | 19.8% |
| 2081 | projected | 4,058,507 | 23.2% | 3,510,430 | 20.0% |
| 2082 | projected | 4,072,807 | 23.1% | 3,584,715 | 20.3% |
| 2083 | projected | 4,086,037 | 23.0% | 3,659,819 | 20.6% |
| 2084 | projected | 4,098,881 | 22.9% | 3,733,387 | 20.8% |
| 2085 | projected | 4,110,313 | 22.8% | 3,803,274 | 21.1% |
| 2086 | projected | 4,119,959 | 22.7% | 3,873,531 | 21.3% |
| 2087 | projected | 4,127,740 | 22.5% | 3,944,517 | 21.5% |
| 2088 | projected | 4,133,202 | 22.4% | 4,011,459 | 21.8% |
| 2089 | projected | 4,136,282 | 22.3% | 4,075,180 | 22.0% |
| 2090 | projected | 4,138,319 | 22.2% | 4,137,248 | 22.2% |
| 2091 | projected | 4,140,339 | 22.0% | 4,198,341 | 22.3% |
| 2092 | projected | 4,141,649 | 21.9% | 4,258,637 | 22.5% |
| 2093 | projected | 4,142,227 | 21.8% | 4,318,168 | 22.7% |
| 2094 | projected | 4,141,480 | 21.6% | 4,376,905 | 22.9% |
| 2095 | projected | 4,139,338 | 21.5% | 4,435,115 | 23.0% |
| 2096 | projected | 4,136,958 | 21.4% | 4,493,357 | 23.2% |
| 2097 | projected | 4,133,734 | 21.2% | 4,551,906 | 23.4% |
| 2098 | projected | 4,129,605 | 21.1% | 4,610,477 | 23.6% |
| 2099 | projected | 4,126,447 | 21.0% | 4,669,071 | 23.8% |
| 2100 | projected | 4,123,958 | 20.9% | 4,727,735 | 23.9% |