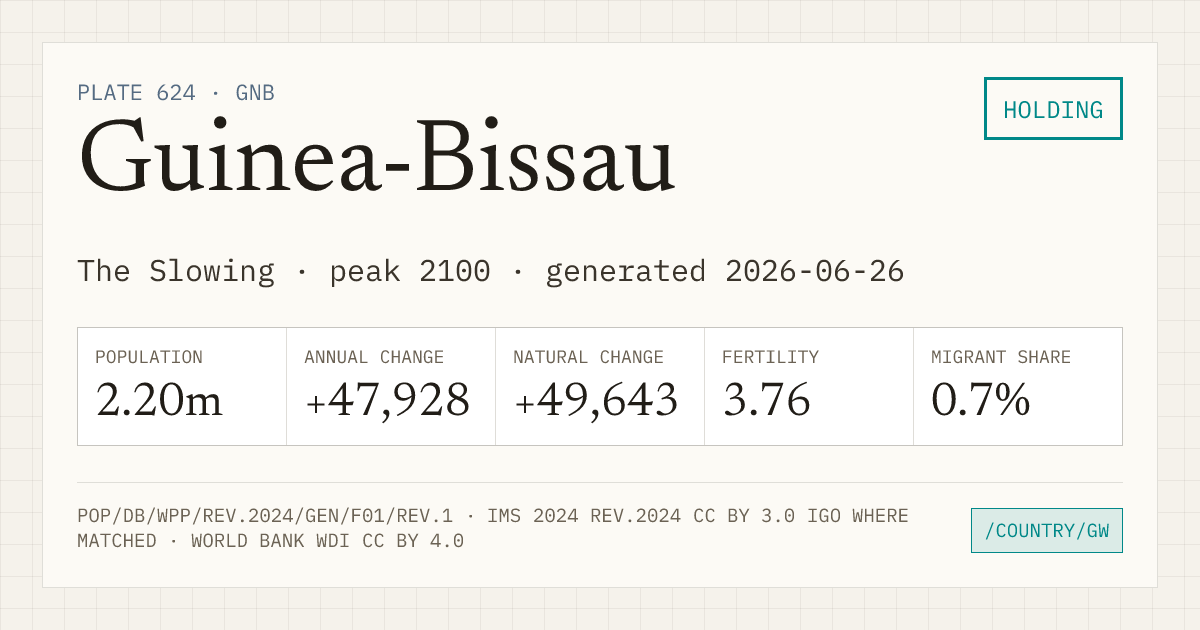
Guinea-Bissau
- Fertility
- 3.76 203 of 237 with a TFR, lowest first
- World population rank
- 148 of 237
- Regional population rank
- 46 of 58 in Africa
- Population
- 2.20m
- Annual change
- +47,928
- Natural change
- +49,643
- Migrant share
- 0.7%
What drives population change?
Births and deaths set natural change. Net migration can reinforce, reduce, or reverse that direction.
Negative net migration slows natural growth without reversing it.
Guinea-Bissau, 2024 projected: natural change +49,643 people, net migration −1,712, WPP adjustment −3, total population change +47,928. Negative net migration slows natural growth without reversing it.
Exact reconciliation: WPP includes a −3-person statistical adjustment. Figures are rounded to whole people.
SOURCE · UN WPP 2024 CHECKS PASSED · DETAILS⌄
Growth in this series
- Current run
- Since 1972 53 consecutive years · projected 2024
- Latest annual gain
- +47,928 2.18% of 2024 population
- Series maximum
- not established in this series Still rising at the 2100 horizon of this release.
Guinea-Bissau observed 2023 population pyramid. Mirrored bars compare male and female population from oldest to youngest across 85+, 80–84, 75–79, 70–74, 65–69, 60–64, 55–59, 50–54, 45–49, 40–44, 35–39, 30–34, 25–29, 20–24, 15–19, 10–14, 5–9, 0–4 age bands.
| Year | Population | Annual change | Fertility |
|---|---|---|---|
| 2024 | 2.20m | +47,928 | 3.76 |
| 2050 | 3.44m | +45,199 | 2.56 |
| 2080 | 4.42m | +19,387 | 2.09 |
| 2100 | 4.67m | +6,161 | 1.94 |
Values after 2023 are medium-variant projections, not forecasts.
Youth and older population
Annual share of the population aged under 18 and aged 65+. The crossing shows when the older group first becomes larger in the annual source series.
- First annual crossover
- Not reached by 2100
- Rule
- 65+ strictly exceeds under 18
Guinea-Bissau annual age balance from 1950 to 2100. Under-18 population moves from 43.9% in 1950 to 46.0% in 2023 and 23.7% in the 2100 projection. Population aged 65 and older moves from 3.5% to 3.1% and 15.4%. First annual crossover: Not reached by 2100. Estimates run through 2023 and WPP Medium projections begin in 2024.
- 1950
- Under 18 · 43.9%65+ · 3.5%
- 2023 observed
- Under 18 · 46.0%65+ · 3.1%
- 2100 projected
- Under 18 · 23.7%65+ · 15.4%
Annual evidence · 151 source rows
| Year | Evidence | Under 18 | Share | 65+ | Share |
|---|---|---|---|---|---|
| 1950 | observed | 238,825 | 43.9% | 18,780 | 3.5% |
| 1951 | observed | 240,744 | 43.8% | 19,338 | 3.5% |
| 1952 | observed | 241,177 | 43.5% | 19,908 | 3.6% |
| 1953 | observed | 241,394 | 43.3% | 20,442 | 3.7% |
| 1954 | observed | 241,504 | 43.1% | 20,924 | 3.7% |
| 1955 | observed | 241,630 | 42.8% | 21,375 | 3.8% |
| 1956 | observed | 241,794 | 42.6% | 21,786 | 3.8% |
| 1957 | observed | 241,932 | 42.5% | 22,147 | 3.9% |
| 1958 | observed | 242,058 | 42.3% | 22,495 | 3.9% |
| 1959 | observed | 242,236 | 42.1% | 22,884 | 4.0% |
| 1960 | observed | 242,493 | 42.0% | 23,344 | 4.0% |
| 1961 | observed | 245,948 | 42.2% | 23,727 | 4.1% |
| 1962 | observed | 252,200 | 42.8% | 24,073 | 4.1% |
| 1963 | observed | 258,051 | 43.4% | 24,402 | 4.1% |
| 1964 | observed | 262,326 | 44.6% | 24,417 | 4.1% |
| 1965 | observed | 264,835 | 46.1% | 24,221 | 4.2% |
| 1966 | observed | 267,372 | 47.2% | 24,140 | 4.3% |
| 1967 | observed | 271,000 | 47.6% | 24,215 | 4.3% |
| 1968 | observed | 275,374 | 47.6% | 24,417 | 4.2% |
| 1969 | observed | 278,570 | 47.9% | 24,581 | 4.2% |
| 1970 | observed | 281,288 | 48.1% | 24,866 | 4.3% |
| 1971 | observed | 283,494 | 48.4% | 25,256 | 4.3% |
| 1972 | observed | 285,124 | 48.6% | 25,739 | 4.4% |
| 1973 | observed | 287,358 | 48.5% | 26,466 | 4.5% |
| 1974 | observed | 296,854 | 48.4% | 28,187 | 4.6% |
| 1975 | observed | 316,332 | 48.6% | 30,844 | 4.7% |
| 1976 | observed | 340,899 | 49.1% | 33,431 | 4.8% |
| 1977 | observed | 369,630 | 49.8% | 35,867 | 4.8% |
| 1978 | observed | 400,683 | 50.6% | 38,081 | 4.8% |
| 1979 | observed | 416,741 | 50.8% | 38,958 | 4.8% |
| 1980 | observed | 421,038 | 50.8% | 39,460 | 4.8% |
| 1981 | observed | 429,385 | 51.0% | 40,744 | 4.8% |
| 1982 | observed | 438,183 | 51.2% | 41,995 | 4.9% |
| 1983 | observed | 447,313 | 51.4% | 43,221 | 5.0% |
| 1984 | observed | 456,648 | 51.7% | 44,387 | 5.0% |
| 1985 | observed | 466,016 | 51.9% | 45,500 | 5.1% |
| 1986 | observed | 475,204 | 52.1% | 46,546 | 5.1% |
| 1987 | observed | 484,088 | 52.2% | 47,518 | 5.1% |
| 1988 | observed | 492,703 | 52.3% | 48,478 | 5.1% |
| 1989 | observed | 501,131 | 52.3% | 49,383 | 5.2% |
| 1990 | observed | 509,044 | 52.3% | 50,270 | 5.2% |
| 1991 | observed | 519,514 | 52.2% | 50,227 | 5.0% |
| 1992 | observed | 534,639 | 52.2% | 49,477 | 4.8% |
| 1993 | observed | 551,845 | 52.1% | 49,025 | 4.6% |
| 1994 | observed | 568,242 | 52.0% | 48,535 | 4.4% |
| 1995 | observed | 581,794 | 51.9% | 47,878 | 4.3% |
| 1996 | observed | 593,377 | 51.9% | 47,097 | 4.1% |
| 1997 | observed | 604,248 | 51.8% | 46,288 | 4.0% |
| 1998 | observed | 614,784 | 51.8% | 45,530 | 3.8% |
| 1999 | observed | 625,301 | 51.7% | 44,871 | 3.7% |
| 2000 | observed | 636,086 | 51.5% | 44,328 | 3.6% |
| 2001 | observed | 647,399 | 51.3% | 43,927 | 3.5% |
| 2002 | observed | 659,293 | 51.1% | 43,606 | 3.4% |
| 2003 | observed | 671,926 | 50.9% | 43,363 | 3.3% |
| 2004 | observed | 685,184 | 50.8% | 43,191 | 3.2% |
| 2005 | observed | 699,085 | 50.6% | 43,100 | 3.1% |
| 2006 | observed | 713,859 | 50.4% | 43,100 | 3.0% |
| 2007 | observed | 729,529 | 50.3% | 43,238 | 3.0% |
| 2008 | observed | 745,945 | 50.1% | 43,493 | 2.9% |
| 2009 | observed | 762,969 | 50.0% | 43,887 | 2.9% |
| 2010 | observed | 780,444 | 49.8% | 44,473 | 2.8% |
| 2011 | observed | 798,476 | 49.7% | 45,229 | 2.8% |
| 2012 | observed | 817,042 | 49.5% | 46,182 | 2.8% |
| 2013 | observed | 835,881 | 49.3% | 47,356 | 2.8% |
| 2014 | observed | 854,511 | 49.1% | 48,746 | 2.8% |
| 2015 | observed | 872,454 | 48.8% | 50,375 | 2.8% |
| 2016 | observed | 889,572 | 48.6% | 52,202 | 2.8% |
| 2017 | observed | 905,603 | 48.2% | 54,227 | 2.9% |
| 2018 | observed | 920,693 | 47.9% | 56,398 | 2.9% |
| 2019 | observed | 935,372 | 47.5% | 58,695 | 3.0% |
| 2020 | observed | 949,686 | 47.2% | 60,783 | 3.0% |
| 2021 | observed | 963,506 | 46.8% | 62,729 | 3.0% |
| 2022 | observed | 976,829 | 46.4% | 65,066 | 3.1% |
| 2023 | observed | 989,608 | 46.0% | 67,673 | 3.1% |
| 2024 | projected | 1,001,760 | 45.5% | 70,264 | 3.2% |
| 2025 | projected | 1,013,164 | 45.0% | 72,821 | 3.2% |
| 2026 | projected | 1,023,937 | 44.6% | 75,348 | 3.3% |
| 2027 | projected | 1,034,371 | 44.1% | 77,870 | 3.3% |
| 2028 | projected | 1,044,197 | 43.6% | 80,359 | 3.4% |
| 2029 | projected | 1,053,091 | 43.1% | 82,841 | 3.4% |
| 2030 | projected | 1,061,146 | 42.6% | 85,348 | 3.4% |
| 2031 | projected | 1,068,659 | 42.1% | 87,971 | 3.5% |
| 2032 | projected | 1,076,114 | 41.6% | 90,794 | 3.5% |
| 2033 | projected | 1,083,818 | 41.1% | 93,934 | 3.6% |
| 2034 | projected | 1,091,576 | 40.7% | 97,435 | 3.6% |
| 2035 | projected | 1,099,486 | 40.3% | 101,332 | 3.7% |
| 2036 | projected | 1,107,817 | 39.9% | 105,693 | 3.8% |
| 2037 | projected | 1,116,081 | 39.5% | 110,508 | 3.9% |
| 2038 | projected | 1,123,859 | 39.1% | 115,697 | 4.0% |
| 2039 | projected | 1,131,294 | 38.7% | 121,285 | 4.2% |
| 2040 | projected | 1,138,369 | 38.3% | 127,177 | 4.3% |
| 2041 | projected | 1,145,008 | 38.0% | 133,246 | 4.4% |
| 2042 | projected | 1,151,362 | 37.6% | 139,397 | 4.6% |
| 2043 | projected | 1,157,575 | 37.2% | 145,397 | 4.7% |
| 2044 | projected | 1,163,499 | 36.9% | 151,439 | 4.8% |
| 2045 | projected | 1,169,245 | 36.5% | 157,947 | 4.9% |
| 2046 | projected | 1,174,522 | 36.1% | 164,874 | 5.1% |
| 2047 | projected | 1,179,398 | 35.8% | 172,140 | 5.2% |
| 2048 | projected | 1,184,079 | 35.4% | 179,694 | 5.4% |
| 2049 | projected | 1,188,435 | 35.0% | 187,428 | 5.5% |
| 2050 | projected | 1,192,414 | 34.7% | 195,287 | 5.7% |
| 2051 | projected | 1,195,907 | 34.3% | 203,192 | 5.8% |
| 2052 | projected | 1,198,813 | 34.0% | 211,128 | 6.0% |
| 2053 | projected | 1,201,136 | 33.7% | 219,117 | 6.1% |
| 2054 | projected | 1,203,404 | 33.3% | 227,316 | 6.3% |
| 2055 | projected | 1,205,506 | 33.0% | 235,503 | 6.5% |
| 2056 | projected | 1,207,039 | 32.7% | 243,598 | 6.6% |
| 2057 | projected | 1,208,383 | 32.4% | 251,939 | 6.8% |
| 2058 | projected | 1,209,727 | 32.1% | 260,584 | 6.9% |
| 2059 | projected | 1,210,867 | 31.8% | 269,461 | 7.1% |
| 2060 | projected | 1,211,469 | 31.5% | 278,501 | 7.2% |
| 2061 | projected | 1,211,827 | 31.2% | 287,683 | 7.4% |
| 2062 | projected | 1,212,206 | 30.9% | 297,090 | 7.6% |
| 2063 | projected | 1,212,365 | 30.7% | 306,707 | 7.8% |
| 2064 | projected | 1,212,306 | 30.4% | 316,471 | 7.9% |
| 2065 | projected | 1,212,151 | 30.1% | 326,401 | 8.1% |
| 2066 | projected | 1,211,603 | 29.9% | 336,448 | 8.3% |
| 2067 | projected | 1,210,683 | 29.6% | 346,669 | 8.5% |
| 2068 | projected | 1,209,730 | 29.4% | 357,227 | 8.7% |
| 2069 | projected | 1,208,580 | 29.1% | 368,025 | 8.9% |
| 2070 | projected | 1,207,123 | 28.9% | 379,096 | 9.1% |
| 2071 | projected | 1,205,514 | 28.7% | 390,568 | 9.3% |
| 2072 | projected | 1,203,889 | 28.5% | 402,502 | 9.5% |
| 2073 | projected | 1,202,289 | 28.2% | 414,755 | 9.7% |
| 2074 | projected | 1,200,488 | 28.0% | 427,115 | 10.0% |
| 2075 | projected | 1,198,670 | 27.8% | 439,741 | 10.2% |
| 2076 | projected | 1,196,811 | 27.6% | 452,781 | 10.4% |
| 2077 | projected | 1,194,606 | 27.4% | 466,164 | 10.7% |
| 2078 | projected | 1,192,087 | 27.2% | 479,786 | 10.9% |
| 2079 | projected | 1,189,317 | 27.0% | 493,252 | 11.2% |
| 2080 | projected | 1,186,343 | 26.8% | 506,336 | 11.4% |
| 2081 | projected | 1,182,814 | 26.6% | 518,912 | 11.7% |
| 2082 | projected | 1,178,957 | 26.4% | 530,751 | 11.9% |
| 2083 | projected | 1,175,108 | 26.3% | 542,019 | 12.1% |
| 2084 | projected | 1,171,356 | 26.1% | 553,131 | 12.3% |
| 2085 | projected | 1,167,637 | 25.9% | 564,215 | 12.5% |
| 2086 | projected | 1,163,875 | 25.7% | 575,272 | 12.7% |
| 2087 | projected | 1,160,020 | 25.6% | 586,227 | 12.9% |
| 2088 | projected | 1,155,954 | 25.4% | 597,037 | 13.1% |
| 2089 | projected | 1,151,803 | 25.3% | 607,717 | 13.3% |
| 2090 | projected | 1,147,642 | 25.1% | 618,220 | 13.5% |
| 2091 | projected | 1,143,497 | 24.9% | 628,613 | 13.7% |
| 2092 | projected | 1,139,481 | 24.8% | 639,018 | 13.9% |
| 2093 | projected | 1,135,536 | 24.6% | 649,422 | 14.1% |
| 2094 | projected | 1,131,604 | 24.5% | 659,807 | 14.3% |
| 2095 | projected | 1,127,442 | 24.4% | 670,064 | 14.5% |
| 2096 | projected | 1,123,132 | 24.2% | 680,197 | 14.7% |
| 2097 | projected | 1,118,941 | 24.1% | 690,254 | 14.9% |
| 2098 | projected | 1,114,668 | 24.0% | 700,209 | 15.1% |
| 2099 | projected | 1,110,454 | 23.8% | 710,133 | 15.2% |
| 2100 | projected | 1,106,265 | 23.7% | 719,945 | 15.4% |