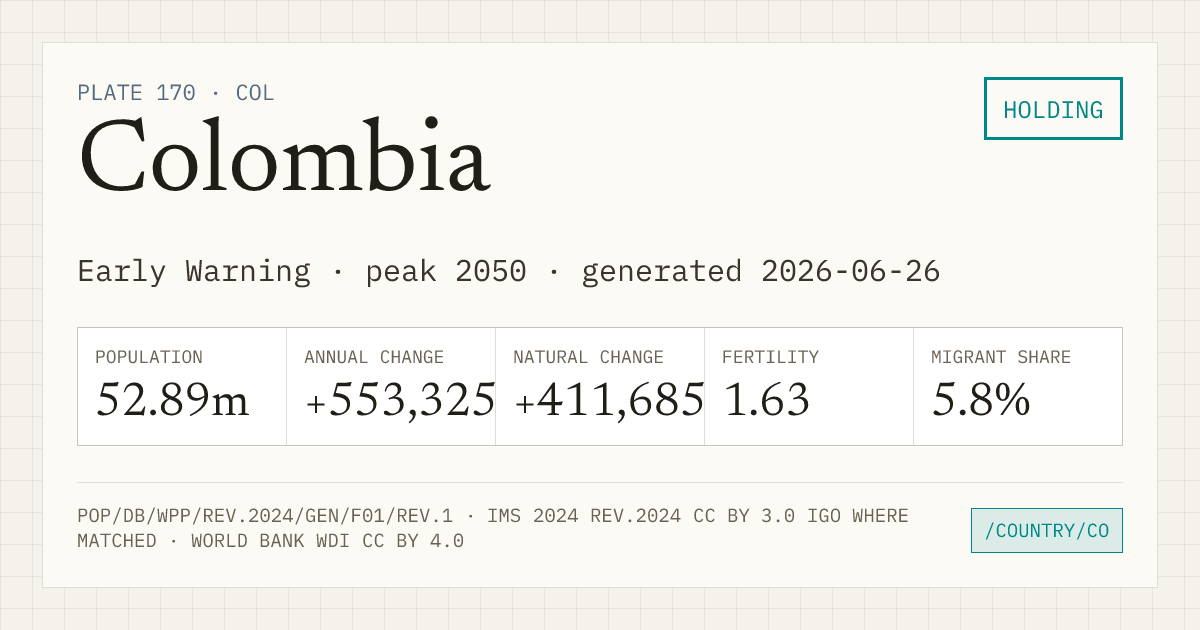
Colombia
- Fertility
- 1.63 91 of 237 with a TFR, lowest first
- World population rank
- 28 of 237
- Regional population rank
- 3 of 50 in Latin America and the Caribbean
- Population
- 52.89m
- Annual change
- +553,325
- Natural change
- +411,685
- Migrant share
- 5.8%
What drives population change?
Births and deaths set natural change. Net migration can reinforce, reduce, or reverse that direction.
Positive net migration adds to natural growth.
Colombia, 2024 projected: natural change +411,685 people, net migration +141,643, WPP adjustment −3, total population change +553,325. Positive net migration adds to natural growth.
Exact reconciliation: WPP includes a −3-person statistical adjustment. Figures are rounded to whole people.
SOURCE · UN WPP 2024 CHECKS PASSED · DETAILS⌄
Growth in this series
- Current run
- Since 1950 75 consecutive years · projected 2024
- Latest annual gain
- +553,325 1.05% of 2024 population
- Series maximum
- projected 2050 Projected from the WPP medium variant, not a forecast.
Colombia observed 2023 population pyramid. Mirrored bars compare male and female population from oldest to youngest across 85+, 80–84, 75–79, 70–74, 65–69, 60–64, 55–59, 50–54, 45–49, 40–44, 35–39, 30–34, 25–29, 20–24, 15–19, 10–14, 5–9, 0–4 age bands.
| Year | Population | Annual change | Fertility |
|---|---|---|---|
| 2024 | 52.89m | +553,325 | 1.63 |
| 2050 | 59.39m | +3,689 | 1.58 |
| 2080 | 54.27m | −333,683 | 1.59 |
| 2100 | 47.08m | −339,943 | 1.60 |
Values after 2023 are medium-variant projections, not forecasts.
Youth and older population
Annual share of the population aged under 18 and aged 65+. The crossing shows when the older group first becomes larger in the annual source series.
- First annual crossover
- 2046 · projected
- Rule
- 65+ strictly exceeds under 18
Colombia annual age balance from 1950 to 2100. Under-18 population moves from 50.2% in 1950 to 25.1% in 2023 and 14.8% in the 2100 projection. Population aged 65 and older moves from 3.2% to 9.4% and 35.4%. First annual crossover: 2046 · projected. Estimates run through 2023 and WPP Medium projections begin in 2024.
- 1950
- Under 18 · 50.2%65+ · 3.2%
- 2023 observed
- Under 18 · 25.1%65+ · 9.4%
- 2100 projected
- Under 18 · 14.8%65+ · 35.4%
Annual evidence · 151 source rows
| Year | Evidence | Under 18 | Share | 65+ | Share |
|---|---|---|---|---|---|
| 1950 | observed | 5,906,101 | 50.2% | 376,228 | 3.2% |
| 1951 | observed | 6,088,936 | 50.4% | 379,856 | 3.1% |
| 1952 | observed | 6,284,519 | 50.7% | 384,954 | 3.1% |
| 1953 | observed | 6,493,538 | 50.9% | 390,991 | 3.1% |
| 1954 | observed | 6,715,395 | 51.3% | 397,361 | 3.0% |
| 1955 | observed | 6,950,300 | 51.6% | 403,894 | 3.0% |
| 1956 | observed | 7,197,282 | 51.9% | 410,673 | 3.0% |
| 1957 | observed | 7,456,127 | 52.2% | 418,034 | 2.9% |
| 1958 | observed | 7,724,854 | 52.6% | 426,102 | 2.9% |
| 1959 | observed | 8,003,047 | 52.9% | 435,059 | 2.9% |
| 1960 | observed | 8,290,802 | 53.1% | 445,174 | 2.9% |
| 1961 | observed | 8,584,843 | 53.3% | 456,174 | 2.8% |
| 1962 | observed | 8,882,396 | 53.5% | 467,983 | 2.8% |
| 1963 | observed | 9,180,880 | 53.6% | 480,676 | 2.8% |
| 1964 | observed | 9,478,003 | 53.7% | 494,279 | 2.8% |
| 1965 | observed | 9,771,901 | 53.8% | 508,787 | 2.8% |
| 1966 | observed | 10,060,442 | 53.8% | 524,228 | 2.8% |
| 1967 | observed | 10,332,144 | 53.7% | 540,712 | 2.8% |
| 1968 | observed | 10,582,731 | 53.5% | 558,081 | 2.8% |
| 1969 | observed | 10,817,017 | 53.3% | 576,426 | 2.8% |
| 1970 | observed | 11,032,947 | 53.0% | 596,243 | 2.9% |
| 1971 | observed | 11,228,645 | 52.7% | 617,586 | 2.9% |
| 1972 | observed | 11,406,121 | 52.3% | 640,176 | 2.9% |
| 1973 | observed | 11,569,057 | 51.8% | 664,282 | 3.0% |
| 1974 | observed | 11,718,950 | 51.3% | 690,694 | 3.0% |
| 1975 | observed | 11,858,517 | 50.8% | 719,534 | 3.1% |
| 1976 | observed | 11,990,742 | 50.3% | 751,173 | 3.1% |
| 1977 | observed | 12,119,523 | 49.7% | 786,045 | 3.2% |
| 1978 | observed | 12,241,610 | 49.1% | 823,067 | 3.3% |
| 1979 | observed | 12,355,537 | 48.4% | 860,088 | 3.4% |
| 1980 | observed | 12,469,749 | 47.8% | 896,600 | 3.4% |
| 1981 | observed | 12,585,804 | 47.1% | 933,186 | 3.5% |
| 1982 | observed | 12,704,308 | 46.5% | 970,353 | 3.5% |
| 1983 | observed | 12,824,942 | 45.8% | 1,007,870 | 3.6% |
| 1984 | observed | 12,940,266 | 45.2% | 1,044,817 | 3.6% |
| 1985 | observed | 13,043,241 | 44.6% | 1,077,821 | 3.7% |
| 1986 | observed | 13,145,757 | 44.0% | 1,111,496 | 3.7% |
| 1987 | observed | 13,260,334 | 43.5% | 1,149,700 | 3.8% |
| 1988 | observed | 13,386,373 | 43.0% | 1,188,930 | 3.8% |
| 1989 | observed | 13,526,194 | 42.6% | 1,229,950 | 3.9% |
| 1990 | observed | 13,680,972 | 42.2% | 1,273,074 | 3.9% |
| 1991 | observed | 13,844,514 | 41.8% | 1,317,800 | 4.0% |
| 1992 | observed | 14,015,859 | 41.5% | 1,363,436 | 4.0% |
| 1993 | observed | 14,194,089 | 41.2% | 1,409,756 | 4.1% |
| 1994 | observed | 14,367,340 | 40.9% | 1,456,773 | 4.1% |
| 1995 | observed | 14,521,756 | 40.6% | 1,504,441 | 4.2% |
| 1996 | observed | 14,654,816 | 40.2% | 1,553,999 | 4.3% |
| 1997 | observed | 14,776,199 | 39.8% | 1,607,208 | 4.3% |
| 1998 | observed | 14,888,925 | 39.4% | 1,663,953 | 4.4% |
| 1999 | observed | 14,982,127 | 39.0% | 1,721,801 | 4.5% |
| 2000 | observed | 15,048,763 | 38.5% | 1,779,072 | 4.6% |
| 2001 | observed | 15,098,629 | 38.0% | 1,836,794 | 4.6% |
| 2002 | observed | 15,145,480 | 37.6% | 1,896,511 | 4.7% |
| 2003 | observed | 15,192,910 | 37.1% | 1,959,977 | 4.8% |
| 2004 | observed | 15,229,080 | 36.7% | 2,028,405 | 4.9% |
| 2005 | observed | 15,241,834 | 36.2% | 2,101,949 | 5.0% |
| 2006 | observed | 15,224,498 | 35.7% | 2,185,363 | 5.1% |
| 2007 | observed | 15,178,590 | 35.1% | 2,280,222 | 5.3% |
| 2008 | observed | 15,108,468 | 34.5% | 2,385,240 | 5.5% |
| 2009 | observed | 15,016,643 | 33.9% | 2,498,031 | 5.6% |
| 2010 | observed | 14,899,628 | 33.3% | 2,615,839 | 5.8% |
| 2011 | observed | 14,748,702 | 32.6% | 2,741,670 | 6.1% |
| 2012 | observed | 14,573,837 | 31.9% | 2,877,259 | 6.3% |
| 2013 | observed | 14,393,936 | 31.2% | 3,020,450 | 6.5% |
| 2014 | observed | 14,215,291 | 30.5% | 3,175,199 | 6.8% |
| 2015 | observed | 14,033,262 | 29.9% | 3,339,155 | 7.1% |
| 2016 | observed | 13,854,728 | 29.2% | 3,504,957 | 7.4% |
| 2017 | observed | 13,717,898 | 28.5% | 3,683,226 | 7.7% |
| 2018 | observed | 13,627,468 | 27.8% | 3,879,480 | 7.9% |
| 2019 | observed | 13,547,291 | 27.1% | 4,087,627 | 8.2% |
| 2020 | observed | 13,452,401 | 26.6% | 4,285,386 | 8.5% |
| 2021 | observed | 13,344,485 | 26.1% | 4,460,306 | 8.7% |
| 2022 | observed | 13,241,070 | 25.6% | 4,659,809 | 9.0% |
| 2023 | observed | 13,147,025 | 25.1% | 4,905,329 | 9.4% |
| 2024 | projected | 13,067,973 | 24.7% | 5,171,462 | 9.8% |
| 2025 | projected | 12,997,654 | 24.3% | 5,449,471 | 10.2% |
| 2026 | projected | 12,922,264 | 24.0% | 5,736,861 | 10.6% |
| 2027 | projected | 12,845,623 | 23.6% | 6,032,216 | 11.1% |
| 2028 | projected | 12,777,381 | 23.3% | 6,333,366 | 11.5% |
| 2029 | projected | 12,718,881 | 23.0% | 6,637,584 | 12.0% |
| 2030 | projected | 12,661,320 | 22.7% | 6,942,076 | 12.5% |
| 2031 | projected | 12,598,663 | 22.4% | 7,243,808 | 12.9% |
| 2032 | projected | 12,531,303 | 22.2% | 7,540,188 | 13.3% |
| 2033 | projected | 12,463,329 | 21.9% | 7,828,890 | 13.8% |
| 2034 | projected | 12,398,809 | 21.7% | 8,108,155 | 14.2% |
| 2035 | projected | 12,326,980 | 21.5% | 8,377,699 | 14.6% |
| 2036 | projected | 12,237,338 | 21.2% | 8,638,094 | 15.0% |
| 2037 | projected | 12,130,252 | 20.9% | 8,890,235 | 15.3% |
| 2038 | projected | 12,010,574 | 20.6% | 9,136,290 | 15.7% |
| 2039 | projected | 11,884,273 | 20.4% | 9,379,039 | 16.1% |
| 2040 | projected | 11,753,460 | 20.1% | 9,621,360 | 16.4% |
| 2041 | projected | 11,620,855 | 19.8% | 9,866,630 | 16.8% |
| 2042 | projected | 11,487,383 | 19.5% | 10,115,863 | 17.2% |
| 2043 | projected | 11,355,122 | 19.2% | 10,365,380 | 17.6% |
| 2044 | projected | 11,227,241 | 19.0% | 10,616,038 | 18.0% |
| 2045 | projected | 11,103,200 | 18.8% | 10,873,098 | 18.4% |
| 2046 | projected | 10,982,221 | 18.5% | 11,137,692 | 18.8% |
| 2047 | projected | 10,864,836 | 18.3% | 11,409,506 | 19.2% |
| 2048 | projected | 10,751,367 | 18.1% | 11,684,690 | 19.7% |
| 2049 | projected | 10,642,254 | 17.9% | 11,956,314 | 20.1% |
| 2050 | projected | 10,537,819 | 17.7% | 12,222,891 | 20.6% |
| 2051 | projected | 10,437,720 | 17.6% | 12,490,123 | 21.0% |
| 2052 | projected | 10,341,684 | 17.4% | 12,762,468 | 21.5% |
| 2053 | projected | 10,249,969 | 17.3% | 13,040,958 | 22.0% |
| 2054 | projected | 10,161,889 | 17.1% | 13,328,144 | 22.5% |
| 2055 | projected | 10,076,308 | 17.0% | 13,626,191 | 23.0% |
| 2056 | projected | 9,992,619 | 16.9% | 13,935,325 | 23.5% |
| 2057 | projected | 9,910,854 | 16.8% | 14,255,532 | 24.1% |
| 2058 | projected | 9,831,154 | 16.7% | 14,586,542 | 24.7% |
| 2059 | projected | 9,752,881 | 16.5% | 14,922,186 | 25.3% |
| 2060 | projected | 9,675,671 | 16.4% | 15,249,692 | 25.9% |
| 2061 | projected | 9,599,307 | 16.3% | 15,562,175 | 26.5% |
| 2062 | projected | 9,522,818 | 16.3% | 15,865,734 | 27.1% |
| 2063 | projected | 9,446,157 | 16.2% | 16,165,652 | 27.7% |
| 2064 | projected | 9,369,481 | 16.1% | 16,452,452 | 28.2% |
| 2065 | projected | 9,292,047 | 16.0% | 16,718,086 | 28.8% |
| 2066 | projected | 9,213,949 | 15.9% | 16,963,000 | 29.3% |
| 2067 | projected | 9,135,036 | 15.8% | 17,189,183 | 29.8% |
| 2068 | projected | 9,055,362 | 15.7% | 17,397,413 | 30.2% |
| 2069 | projected | 8,975,316 | 15.6% | 17,582,086 | 30.7% |
| 2070 | projected | 8,895,121 | 15.6% | 17,737,053 | 31.0% |
| 2071 | projected | 8,814,668 | 15.5% | 17,863,607 | 31.4% |
| 2072 | projected | 8,733,926 | 15.4% | 17,968,604 | 31.7% |
| 2073 | projected | 8,653,699 | 15.3% | 18,057,225 | 32.0% |
| 2074 | projected | 8,574,240 | 15.3% | 18,127,486 | 32.3% |
| 2075 | projected | 8,495,831 | 15.2% | 18,171,501 | 32.5% |
| 2076 | projected | 8,418,987 | 15.2% | 18,188,084 | 32.8% |
| 2077 | projected | 8,343,344 | 15.1% | 18,186,490 | 32.9% |
| 2078 | projected | 8,269,134 | 15.1% | 18,172,501 | 33.1% |
| 2079 | projected | 8,196,730 | 15.0% | 18,146,552 | 33.2% |
| 2080 | projected | 8,126,092 | 15.0% | 18,106,521 | 33.4% |
| 2081 | projected | 8,057,253 | 14.9% | 18,049,356 | 33.5% |
| 2082 | projected | 7,990,259 | 14.9% | 17,984,943 | 33.6% |
| 2083 | projected | 7,924,872 | 14.9% | 17,925,353 | 33.7% |
| 2084 | projected | 7,861,105 | 14.9% | 17,872,052 | 33.8% |
| 2085 | projected | 7,798,921 | 14.8% | 17,821,260 | 33.9% |
| 2086 | projected | 7,738,122 | 14.8% | 17,768,938 | 34.1% |
| 2087 | projected | 7,678,476 | 14.8% | 17,712,937 | 34.2% |
| 2088 | projected | 7,619,737 | 14.8% | 17,651,747 | 34.3% |
| 2089 | projected | 7,562,142 | 14.8% | 17,586,737 | 34.5% |
| 2090 | projected | 7,505,996 | 14.8% | 17,517,403 | 34.6% |
| 2091 | projected | 7,450,796 | 14.8% | 17,442,184 | 34.7% |
| 2092 | projected | 7,396,060 | 14.8% | 17,362,424 | 34.8% |
| 2093 | projected | 7,341,110 | 14.8% | 17,279,790 | 34.9% |
| 2094 | projected | 7,285,568 | 14.8% | 17,195,141 | 35.0% |
| 2095 | projected | 7,230,559 | 14.8% | 17,108,968 | 35.0% |
| 2096 | projected | 7,176,331 | 14.8% | 17,022,001 | 35.1% |
| 2097 | projected | 7,121,799 | 14.8% | 16,934,035 | 35.2% |
| 2098 | projected | 7,066,628 | 14.8% | 16,845,211 | 35.3% |
| 2099 | projected | 7,010,771 | 14.8% | 16,756,573 | 35.3% |
| 2100 | projected | 6,954,512 | 14.8% | 16,668,068 | 35.4% |