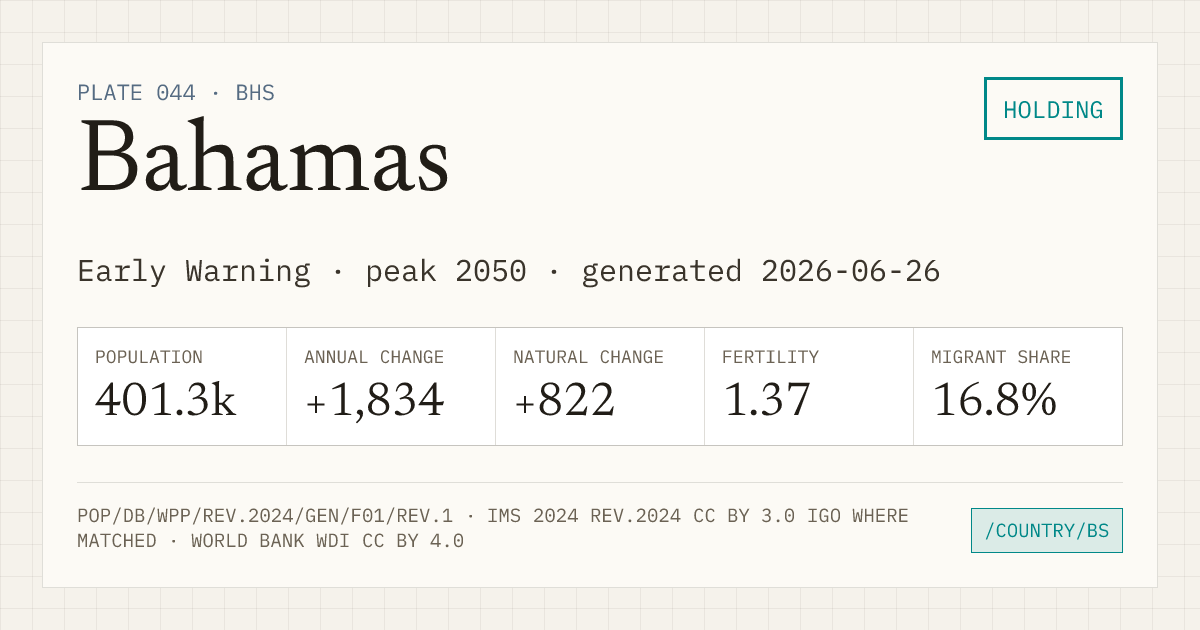
Bahamas
- Fertility
- 1.37 38 of 237 with a TFR, lowest first
- World population rank
- 178 of 237
- Regional population rank
- 27 of 50 in Latin America and the Caribbean
- Population
- 401,283
- Annual change
- +1,834 small absolute movement
- Natural change
- +822
- Migrant share
- 16.8%
What drives population change?
Births and deaths set natural change. Net migration can reinforce, reduce, or reverse that direction.
Positive net migration adds to natural growth.
Bahamas, 2024 projected: natural change +822 people, net migration +1,018, WPP adjustment −6, total population change +1,834. Positive net migration adds to natural growth.
Exact reconciliation: WPP includes a −6-person statistical adjustment. Figures are rounded to whole people.
SOURCE · UN WPP 2024 CHECKS PASSED · DETAILS⌄
Growth in this series
- Current run
- Since 1950 75 consecutive years · projected 2024
- Latest annual gain
- +1,834 0.46% of 2024 population
- Series maximum
- projected 2050 Projected from the WPP medium variant, not a forecast.
Bahamas observed 2023 population pyramid. Mirrored bars compare male and female population from oldest to youngest across 85+, 80–84, 75–79, 70–74, 65–69, 60–64, 55–59, 50–54, 45–49, 40–44, 35–39, 30–34, 25–29, 20–24, 15–19, 10–14, 5–9, 0–4 age bands.
| Year | Population | Annual change | Fertility |
|---|---|---|---|
| 2024 | 401,283 | +1,834 | 1.37 |
| 2050 | 424,265 | −24 | 1.41 |
| 2080 | 405,966 | −983 | 1.48 |
| 2100 | 384,955 | −978 | 1.51 |
Values after 2023 are medium-variant projections, not forecasts.
Youth and older population
Annual share of the population aged under 18 and aged 65+. The crossing shows when the older group first becomes larger in the annual source series.
- First annual crossover
- 2040 · projected
- Rule
- 65+ strictly exceeds under 18
Bahamas annual age balance from 1950 to 2100. Under-18 population moves from 45.8% in 1950 to 22.6% in 2023 and 16.5% in the 2100 projection. Population aged 65 and older moves from 4.6% to 11.5% and 29.1%. First annual crossover: 2040 · projected. Estimates run through 2023 and WPP Medium projections begin in 2024.
- 1950
- Under 18 · 45.8%65+ · 4.6%
- 2023 observed
- Under 18 · 22.6%65+ · 11.5%
- 2100 projected
- Under 18 · 16.5%65+ · 29.1%
Annual evidence · 151 source rows
| Year | Evidence | Under 18 | Share | 65+ | Share |
|---|---|---|---|---|---|
| 1950 | observed | 38,197 | 45.8% | 3,875 | 4.6% |
| 1951 | observed | 38,967 | 46.1% | 3,800 | 4.5% |
| 1952 | observed | 39,973 | 46.4% | 3,768 | 4.4% |
| 1953 | observed | 41,231 | 46.7% | 3,777 | 4.3% |
| 1954 | observed | 42,701 | 47.0% | 3,818 | 4.2% |
| 1955 | observed | 44,346 | 47.2% | 3,877 | 4.1% |
| 1956 | observed | 46,150 | 47.3% | 3,945 | 4.0% |
| 1957 | observed | 48,090 | 47.4% | 4,027 | 4.0% |
| 1958 | observed | 50,167 | 47.3% | 4,120 | 3.9% |
| 1959 | observed | 52,413 | 47.3% | 4,219 | 3.8% |
| 1960 | observed | 54,895 | 47.2% | 4,326 | 3.7% |
| 1961 | observed | 57,638 | 47.2% | 4,446 | 3.6% |
| 1962 | observed | 60,408 | 47.0% | 4,590 | 3.6% |
| 1963 | observed | 63,156 | 46.8% | 4,753 | 3.5% |
| 1964 | observed | 65,890 | 46.6% | 4,935 | 3.5% |
| 1965 | observed | 68,628 | 46.4% | 5,138 | 3.5% |
| 1966 | observed | 71,570 | 46.2% | 5,380 | 3.5% |
| 1967 | observed | 74,713 | 46.0% | 5,634 | 3.5% |
| 1968 | observed | 78,037 | 45.9% | 5,895 | 3.5% |
| 1969 | observed | 81,373 | 45.7% | 6,173 | 3.5% |
| 1970 | observed | 84,342 | 45.6% | 6,423 | 3.5% |
| 1971 | observed | 86,868 | 45.5% | 6,641 | 3.5% |
| 1972 | observed | 89,126 | 45.5% | 6,868 | 3.5% |
| 1973 | observed | 91,124 | 45.4% | 7,127 | 3.5% |
| 1974 | observed | 92,860 | 45.2% | 7,431 | 3.6% |
| 1975 | observed | 94,356 | 45.0% | 7,759 | 3.7% |
| 1976 | observed | 95,642 | 44.6% | 8,143 | 3.8% |
| 1977 | observed | 96,680 | 44.1% | 8,543 | 3.9% |
| 1978 | observed | 97,427 | 43.5% | 8,987 | 4.0% |
| 1979 | observed | 97,874 | 42.9% | 9,429 | 4.1% |
| 1980 | observed | 98,039 | 42.2% | 9,903 | 4.3% |
| 1981 | observed | 97,952 | 41.4% | 10,369 | 4.4% |
| 1982 | observed | 97,652 | 40.6% | 10,843 | 4.5% |
| 1983 | observed | 97,245 | 39.7% | 11,326 | 4.6% |
| 1984 | observed | 96,795 | 38.9% | 11,798 | 4.7% |
| 1985 | observed | 96,347 | 38.1% | 12,249 | 4.8% |
| 1986 | observed | 95,951 | 37.3% | 12,693 | 4.9% |
| 1987 | observed | 95,682 | 36.5% | 13,122 | 5.0% |
| 1988 | observed | 95,593 | 35.9% | 13,571 | 5.1% |
| 1989 | observed | 95,717 | 35.3% | 14,038 | 5.2% |
| 1990 | observed | 96,038 | 34.8% | 14,548 | 5.3% |
| 1991 | observed | 96,560 | 34.4% | 15,080 | 5.4% |
| 1992 | observed | 97,563 | 34.1% | 15,659 | 5.5% |
| 1993 | observed | 98,906 | 33.9% | 16,287 | 5.6% |
| 1994 | observed | 100,138 | 33.8% | 16,952 | 5.7% |
| 1995 | observed | 101,281 | 33.6% | 17,645 | 5.9% |
| 1996 | observed | 102,398 | 33.4% | 18,375 | 6.0% |
| 1997 | observed | 103,446 | 33.3% | 19,137 | 6.2% |
| 1998 | observed | 104,402 | 33.1% | 19,936 | 6.3% |
| 1999 | observed | 105,155 | 32.9% | 20,780 | 6.5% |
| 2000 | observed | 105,715 | 32.6% | 21,678 | 6.7% |
| 2001 | observed | 106,081 | 32.4% | 22,630 | 6.9% |
| 2002 | observed | 106,284 | 32.1% | 23,645 | 7.1% |
| 2003 | observed | 106,429 | 31.7% | 24,744 | 7.4% |
| 2004 | observed | 106,513 | 31.3% | 25,900 | 7.6% |
| 2005 | observed | 106,516 | 31.0% | 27,113 | 7.9% |
| 2006 | observed | 106,515 | 30.6% | 28,376 | 8.1% |
| 2007 | observed | 106,520 | 30.1% | 29,638 | 8.4% |
| 2008 | observed | 106,371 | 29.7% | 30,884 | 8.6% |
| 2009 | observed | 106,115 | 29.2% | 32,236 | 8.9% |
| 2010 | observed | 105,377 | 28.7% | 33,646 | 9.2% |
| 2011 | observed | 104,145 | 28.0% | 34,965 | 9.4% |
| 2012 | observed | 102,986 | 27.4% | 36,187 | 9.6% |
| 2013 | observed | 101,925 | 26.9% | 37,322 | 9.8% |
| 2014 | observed | 100,887 | 26.4% | 38,381 | 10.0% |
| 2015 | observed | 99,751 | 25.9% | 39,342 | 10.2% |
| 2016 | observed | 98,481 | 25.4% | 40,215 | 10.4% |
| 2017 | observed | 97,197 | 24.9% | 41,060 | 10.5% |
| 2018 | observed | 95,997 | 24.4% | 41,892 | 10.7% |
| 2019 | observed | 94,849 | 24.0% | 42,723 | 10.8% |
| 2020 | observed | 93,672 | 23.7% | 43,448 | 11.0% |
| 2021 | observed | 92,547 | 23.3% | 43,967 | 11.1% |
| 2022 | observed | 91,483 | 23.0% | 44,731 | 11.3% |
| 2023 | observed | 90,369 | 22.6% | 45,930 | 11.5% |
| 2024 | projected | 89,215 | 22.2% | 47,253 | 11.8% |
| 2025 | projected | 87,979 | 21.8% | 48,745 | 12.1% |
| 2026 | projected | 86,644 | 21.4% | 50,378 | 12.5% |
| 2027 | projected | 85,249 | 21.0% | 52,142 | 12.8% |
| 2028 | projected | 84,009 | 20.6% | 54,039 | 13.3% |
| 2029 | projected | 82,994 | 20.3% | 56,076 | 13.7% |
| 2030 | projected | 82,010 | 20.0% | 58,189 | 14.2% |
| 2031 | projected | 81,044 | 19.7% | 60,351 | 14.7% |
| 2032 | projected | 80,108 | 19.4% | 62,518 | 15.1% |
| 2033 | projected | 79,357 | 19.2% | 64,693 | 15.6% |
| 2034 | projected | 78,852 | 19.0% | 66,820 | 16.1% |
| 2035 | projected | 78,522 | 18.9% | 68,887 | 16.6% |
| 2036 | projected | 78,288 | 18.8% | 70,874 | 17.0% |
| 2037 | projected | 78,054 | 18.7% | 72,783 | 17.4% |
| 2038 | projected | 77,830 | 18.6% | 74,581 | 17.8% |
| 2039 | projected | 77,590 | 18.5% | 76,265 | 18.2% |
| 2040 | projected | 77,326 | 18.4% | 77,828 | 18.5% |
| 2041 | projected | 77,061 | 18.3% | 79,307 | 18.8% |
| 2042 | projected | 76,776 | 18.2% | 80,681 | 19.1% |
| 2043 | projected | 76,479 | 18.1% | 81,973 | 19.4% |
| 2044 | projected | 76,196 | 18.0% | 83,195 | 19.7% |
| 2045 | projected | 75,910 | 17.9% | 84,353 | 19.9% |
| 2046 | projected | 75,633 | 17.9% | 85,467 | 20.2% |
| 2047 | projected | 75,335 | 17.8% | 86,567 | 20.4% |
| 2048 | projected | 75,011 | 17.7% | 87,658 | 20.7% |
| 2049 | projected | 74,681 | 17.6% | 88,739 | 20.9% |
| 2050 | projected | 74,325 | 17.5% | 89,809 | 21.2% |
| 2051 | projected | 73,966 | 17.4% | 90,900 | 21.4% |
| 2052 | projected | 73,587 | 17.4% | 92,045 | 21.7% |
| 2053 | projected | 73,213 | 17.3% | 93,242 | 22.0% |
| 2054 | projected | 72,843 | 17.2% | 94,478 | 22.3% |
| 2055 | projected | 72,466 | 17.1% | 95,770 | 22.6% |
| 2056 | projected | 72,095 | 17.0% | 97,092 | 22.9% |
| 2057 | projected | 71,745 | 17.0% | 98,618 | 23.3% |
| 2058 | projected | 71,414 | 16.9% | 100,263 | 23.7% |
| 2059 | projected | 71,083 | 16.8% | 101,674 | 24.1% |
| 2060 | projected | 70,753 | 16.8% | 102,887 | 24.4% |
| 2061 | projected | 70,458 | 16.7% | 103,971 | 24.7% |
| 2062 | projected | 70,175 | 16.7% | 104,924 | 25.0% |
| 2063 | projected | 69,918 | 16.7% | 105,734 | 25.2% |
| 2064 | projected | 69,666 | 16.6% | 106,388 | 25.4% |
| 2065 | projected | 69,429 | 16.6% | 106,869 | 25.5% |
| 2066 | projected | 69,212 | 16.6% | 107,276 | 25.7% |
| 2067 | projected | 69,012 | 16.5% | 107,641 | 25.8% |
| 2068 | projected | 68,824 | 16.5% | 108,044 | 25.9% |
| 2069 | projected | 68,655 | 16.5% | 108,526 | 26.1% |
| 2070 | projected | 68,509 | 16.5% | 109,142 | 26.3% |
| 2071 | projected | 68,367 | 16.5% | 109,858 | 26.5% |
| 2072 | projected | 68,207 | 16.5% | 110,672 | 26.8% |
| 2073 | projected | 68,049 | 16.5% | 111,516 | 27.0% |
| 2074 | projected | 67,915 | 16.5% | 112,399 | 27.3% |
| 2075 | projected | 67,794 | 16.5% | 113,131 | 27.6% |
| 2076 | projected | 67,659 | 16.5% | 113,652 | 27.7% |
| 2077 | projected | 67,514 | 16.5% | 114,121 | 27.9% |
| 2078 | projected | 67,377 | 16.5% | 114,585 | 28.1% |
| 2079 | projected | 67,240 | 16.5% | 114,998 | 28.3% |
| 2080 | projected | 67,081 | 16.5% | 115,246 | 28.4% |
| 2081 | projected | 66,929 | 16.5% | 115,279 | 28.5% |
| 2082 | projected | 66,763 | 16.5% | 115,154 | 28.5% |
| 2083 | projected | 66,578 | 16.5% | 114,947 | 28.5% |
| 2084 | projected | 66,386 | 16.5% | 114,711 | 28.5% |
| 2085 | projected | 66,190 | 16.5% | 114,493 | 28.6% |
| 2086 | projected | 65,996 | 16.5% | 114,271 | 28.6% |
| 2087 | projected | 65,782 | 16.5% | 114,072 | 28.6% |
| 2088 | projected | 65,583 | 16.5% | 113,879 | 28.7% |
| 2089 | projected | 65,381 | 16.5% | 113,700 | 28.7% |
| 2090 | projected | 65,194 | 16.5% | 113,531 | 28.7% |
| 2091 | projected | 65,002 | 16.5% | 113,347 | 28.8% |
| 2092 | projected | 64,816 | 16.5% | 113,169 | 28.8% |
| 2093 | projected | 64,632 | 16.5% | 112,996 | 28.8% |
| 2094 | projected | 64,462 | 16.5% | 112,843 | 28.9% |
| 2095 | projected | 64,285 | 16.5% | 112,675 | 28.9% |
| 2096 | projected | 64,131 | 16.5% | 112,534 | 28.9% |
| 2097 | projected | 63,991 | 16.5% | 112,408 | 29.0% |
| 2098 | projected | 63,858 | 16.5% | 112,290 | 29.0% |
| 2099 | projected | 63,731 | 16.5% | 112,176 | 29.1% |
| 2100 | projected | 63,599 | 16.5% | 112,074 | 29.1% |