Population state · Sustained decline
Bosnia and Herzegovina
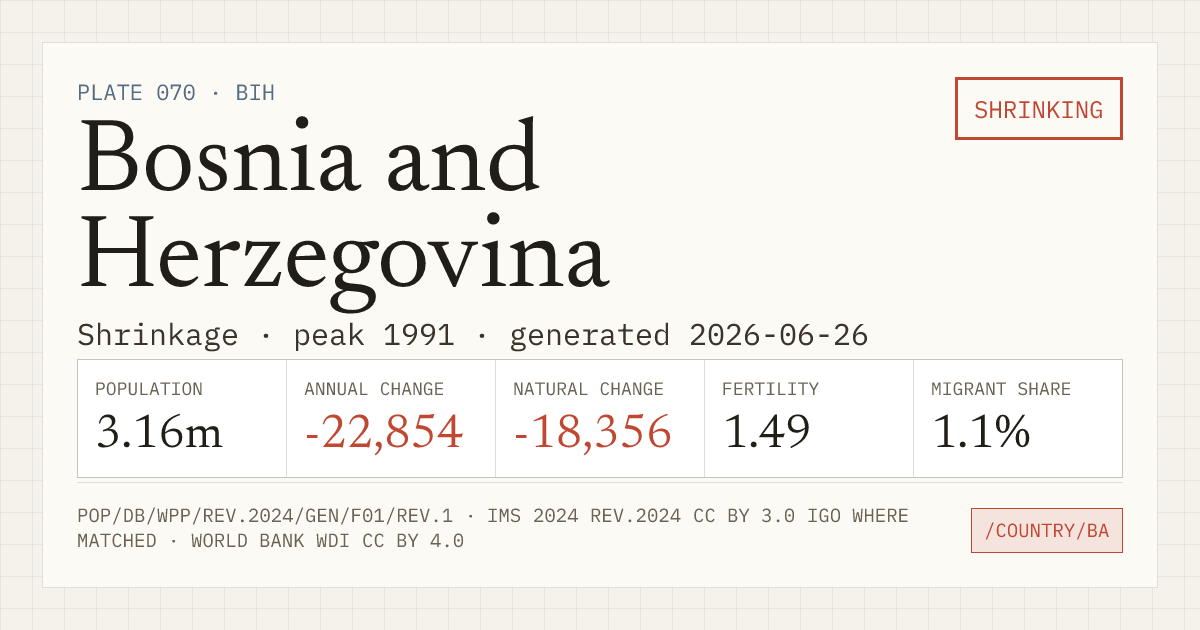
Bosnia and Herzegovina's population reached its series maximum in 1991. The current run began in 2002.
- Fertility
- 1.49 66 of 237 with a TFR, lowest first
- World population rank
- 136 of 237
- Regional population rank
- 28 of 50 in Europe
- Population
- 3.16m
- Annual change
- −22,854 23rd-largest annual loss in the record
- Natural change
- −18,356
- Migrant share
- 1.1%
What drives population change?
Births and deaths set natural change. Net migration can reinforce, reduce, or reverse that direction.
Negative net migration adds to natural decline.
Bosnia and Herzegovina, 2024 projected: natural change −18,356 people, net migration −4,497, WPP adjustment −1, total population change −22,854. Negative net migration adds to natural decline.
Exact reconciliation: WPP includes a −1-person statistical adjustment. Figures are rounded to whole people.
SOURCE · UN WPP 2024 CHECKS PASSED · DETAILS⌄
Decline over time
Annual change through the streak
Each bar is one year’s total population change. View the same evidence as a share of that year’s population or as a count of people.
Births, deaths, net migration, and WPP adjustments are included.One discrete bar for each source year from 2002 through 2024. The chart includes total population change from births, deaths, net migration, and WPP adjustments; observed and projected rows are distinguished.
| Year | Evidence | Percent of population | People |
|---|---|---|---|
| 2002 | observed | −0.06% | −2.3k |
| 2003 | observed | −0.40% | −16.6k |
| 2004 | observed | −1.41% | −58.5k |
| 2005 | observed | −0.75% | −30.5k |
| 2006 | observed | −0.88% | −35.9k |
| 2007 | observed | −1.59% | −63.8k |
| 2008 | observed | −1.72% | −68.0k |
| 2009 | observed | −1.74% | −67.5k |
| 2010 | observed | −1.81% | −69.1k |
| 2011 | observed | −1.88% | −70.2k |
| 2012 | observed | −1.99% | −73.1k |
| 2013 | observed | −1.26% | −45.4k |
| 2014 | observed | −1.31% | −46.7k |
| 2015 | observed | −1.30% | −45.9k |
| 2016 | observed | −1.30% | −45.2k |
| 2017 | observed | −1.27% | −43.5k |
| 2018 | observed | −1.18% | −39.9k |
| 2019 | observed | −1.29% | −43.0k |
| 2020 | observed | −1.50% | −49.3k |
| 2021 | observed | −1.83% | −59.5k |
| 2022 | observed | −0.65% | −20.7k |
| 2023 | observed | −0.59% | −18.8k |
| 2024 | projected | −0.72% | −22.9k |
Population below peak
Peak population minus the 2024 population, shown in people and as a share of the peak.
Annual total population from the literal series maximum in 1991 through 2024, indexed so the peak equals 100. The focused scale shows the stock path while exact annual populations remain in the table.
| Year | Evidence | Population |
|---|---|---|
| 1991 | observed | 4,458,343 |
| 1992 | observed | 4,234,616 |
| 1993 | observed | 3,904,482 |
| 1994 | observed | 3,725,412 |
| 1995 | observed | 3,715,564 |
| 1996 | observed | 3,875,246 |
| 1997 | observed | 4,018,227 |
| 1998 | observed | 4,089,356 |
| 1999 | observed | 4,130,305 |
| 2000 | observed | 4,159,771 |
| 2001 | observed | 4,179,438 |
| 2002 | observed | 4,188,002 |
| 2003 | observed | 4,178,523 |
| 2004 | observed | 4,140,987 |
| 2005 | observed | 4,096,493 |
| 2006 | observed | 4,063,272 |
| 2007 | observed | 4,013,424 |
| 2008 | observed | 3,947,544 |
| 2009 | observed | 3,879,794 |
| 2010 | observed | 3,811,472 |
| 2011 | observed | 3,741,798 |
| 2012 | observed | 3,670,113 |
| 2013 | observed | 3,610,859 |
| 2014 | observed | 3,564,829 |
| 2015 | observed | 3,518,541 |
| 2016 | observed | 3,473,003 |
| 2017 | observed | 3,428,682 |
| 2018 | observed | 3,387,000 |
| 2019 | observed | 3,345,533 |
| 2020 | observed | 3,299,349 |
| 2021 | observed | 3,244,907 |
| 2022 | observed | 3,204,802 |
| 2023 | observed | 3,185,073 |
| 2024 | projected | 3,164,253 |
- Peak population · 1991
- 4.46m
- 2024 population
- 3.16m
From 4,458,343 people in 1991 to 3,164,253 in 2024. The endpoint is projected; the peak year is the literal maximum in the WPP series.
SOURCE · UN WPP 2024 CHECKS PASSED · DETAILS⌄
Bosnia and Herzegovina observed 2023 population pyramid. Mirrored bars compare male and female population from oldest to youngest across 85+, 80–84, 75–79, 70–74, 65–69, 60–64, 55–59, 50–54, 45–49, 40–44, 35–39, 30–34, 25–29, 20–24, 15–19, 10–14, 5–9, 0–4 age bands.
| Year | Population | Annual change | Fertility |
|---|---|---|---|
| 2024 | 3.16m | −22,854 | 1.49 |
| 2050 | 2.46m | −28,288 | 1.57 |
| 2080 | 1.70m | −19,926 | 1.60 |
| 2100 | 1.37m | −14,295 | 1.61 |
Values after 2023 are medium-variant projections, not forecasts.
Youth and older population
Annual share of the population aged under 18 and aged 65+. The crossing shows when the older group first becomes larger in the annual source series.
- First annual crossover
- 2016 · observed
- Rule
- 65+ strictly exceeds under 18
Bosnia and Herzegovina annual age balance from 1950 to 2100. Under-18 population moves from 45.4% in 1950 to 16.3% in 2023 and 13.9% in the 2100 projection. Population aged 65 and older moves from 4.0% to 21.6% and 37.4%. First annual crossover: 2016 · observed. Estimates run through 2023 and WPP Medium projections begin in 2024.
- 1950
- Under 18 · 45.4%65+ · 4.0%
- 2023 observed
- Under 18 · 16.3%65+ · 21.6%
- 2100 projected
- Under 18 · 13.9%65+ · 37.4%
Annual evidence · 151 source rows
| Year | Evidence | Under 18 | Share | 65+ | Share |
|---|---|---|---|---|---|
| 1950 | observed | 1,220,222 | 45.4% | 107,557 | 4.0% |
| 1951 | observed | 1,211,052 | 44.4% | 108,404 | 4.0% |
| 1952 | observed | 1,205,428 | 43.4% | 109,291 | 3.9% |
| 1953 | observed | 1,216,987 | 43.0% | 108,896 | 3.8% |
| 1954 | observed | 1,241,763 | 43.0% | 107,455 | 3.7% |
| 1955 | observed | 1,266,416 | 42.9% | 106,409 | 3.6% |
| 1956 | observed | 1,292,411 | 42.9% | 105,888 | 3.5% |
| 1957 | observed | 1,320,586 | 42.9% | 106,069 | 3.4% |
| 1958 | observed | 1,350,632 | 42.9% | 107,325 | 3.4% |
| 1959 | observed | 1,382,454 | 43.0% | 109,962 | 3.4% |
| 1960 | observed | 1,418,014 | 43.2% | 113,762 | 3.5% |
| 1961 | observed | 1,456,043 | 43.5% | 116,781 | 3.5% |
| 1962 | observed | 1,491,818 | 43.8% | 118,678 | 3.5% |
| 1963 | observed | 1,522,904 | 44.0% | 121,607 | 3.5% |
| 1964 | observed | 1,548,660 | 44.1% | 126,769 | 3.6% |
| 1965 | observed | 1,568,515 | 44.0% | 133,928 | 3.8% |
| 1966 | observed | 1,582,469 | 43.8% | 142,291 | 3.9% |
| 1967 | observed | 1,591,393 | 43.5% | 150,918 | 4.1% |
| 1968 | observed | 1,595,400 | 43.1% | 159,052 | 4.3% |
| 1969 | observed | 1,593,828 | 42.6% | 167,074 | 4.5% |
| 1970 | observed | 1,586,167 | 42.0% | 175,562 | 4.7% |
| 1971 | observed | 1,573,222 | 41.3% | 183,823 | 4.8% |
| 1972 | observed | 1,557,325 | 40.5% | 191,297 | 5.0% |
| 1973 | observed | 1,540,943 | 39.6% | 198,818 | 5.1% |
| 1974 | observed | 1,525,862 | 38.9% | 207,136 | 5.3% |
| 1975 | observed | 1,511,774 | 38.1% | 216,287 | 5.5% |
| 1976 | observed | 1,497,106 | 37.4% | 225,867 | 5.6% |
| 1977 | observed | 1,480,961 | 36.6% | 235,157 | 5.8% |
| 1978 | observed | 1,463,514 | 35.9% | 243,351 | 6.0% |
| 1979 | observed | 1,445,640 | 35.1% | 249,528 | 6.1% |
| 1980 | observed | 1,428,558 | 34.4% | 253,068 | 6.1% |
| 1981 | observed | 1,410,539 | 33.7% | 253,249 | 6.1% |
| 1982 | observed | 1,393,537 | 33.0% | 250,593 | 5.9% |
| 1983 | observed | 1,380,365 | 32.4% | 247,979 | 5.8% |
| 1984 | observed | 1,369,199 | 31.9% | 247,772 | 5.8% |
| 1985 | observed | 1,359,301 | 31.4% | 250,657 | 5.8% |
| 1986 | observed | 1,350,336 | 31.0% | 256,240 | 5.9% |
| 1987 | observed | 1,342,371 | 30.6% | 263,355 | 6.0% |
| 1988 | observed | 1,334,722 | 30.2% | 271,378 | 6.1% |
| 1989 | observed | 1,325,786 | 29.9% | 280,989 | 6.3% |
| 1990 | observed | 1,315,232 | 29.6% | 292,593 | 6.6% |
| 1991 | observed | 1,303,444 | 29.2% | 306,392 | 6.9% |
| 1992 | observed | 1,254,213 | 29.6% | 313,185 | 7.4% |
| 1993 | observed | 1,187,326 | 30.4% | 315,857 | 8.1% |
| 1994 | observed | 1,141,909 | 30.7% | 326,853 | 8.8% |
| 1995 | observed | 1,119,836 | 30.1% | 345,349 | 9.3% |
| 1996 | observed | 1,121,603 | 28.9% | 368,153 | 9.5% |
| 1997 | observed | 1,118,872 | 27.8% | 391,008 | 9.7% |
| 1998 | observed | 1,102,046 | 26.9% | 412,691 | 10.1% |
| 1999 | observed | 1,077,659 | 26.1% | 434,591 | 10.5% |
| 2000 | observed | 1,049,195 | 25.2% | 456,770 | 11.0% |
| 2001 | observed | 1,017,028 | 24.3% | 478,528 | 11.4% |
| 2002 | observed | 983,381 | 23.5% | 499,480 | 11.9% |
| 2003 | observed | 948,717 | 22.7% | 519,367 | 12.4% |
| 2004 | observed | 912,169 | 22.0% | 537,251 | 13.0% |
| 2005 | observed | 876,915 | 21.4% | 552,502 | 13.5% |
| 2006 | observed | 845,356 | 20.8% | 564,216 | 13.9% |
| 2007 | observed | 813,855 | 20.3% | 571,279 | 14.2% |
| 2008 | observed | 782,903 | 19.8% | 574,298 | 14.5% |
| 2009 | observed | 754,051 | 19.4% | 575,185 | 14.8% |
| 2010 | observed | 727,426 | 19.1% | 576,089 | 15.1% |
| 2011 | observed | 704,053 | 18.8% | 578,243 | 15.5% |
| 2012 | observed | 683,565 | 18.6% | 582,495 | 15.9% |
| 2013 | observed | 666,556 | 18.5% | 589,403 | 16.3% |
| 2014 | observed | 650,265 | 18.2% | 597,953 | 16.8% |
| 2015 | observed | 629,906 | 17.9% | 607,069 | 17.3% |
| 2016 | observed | 608,463 | 17.5% | 617,213 | 17.8% |
| 2017 | observed | 590,680 | 17.2% | 628,777 | 18.3% |
| 2018 | observed | 577,064 | 17.0% | 642,716 | 19.0% |
| 2019 | observed | 565,077 | 16.9% | 657,252 | 19.6% |
| 2020 | observed | 552,875 | 16.8% | 667,875 | 20.2% |
| 2021 | observed | 539,899 | 16.6% | 670,968 | 20.7% |
| 2022 | observed | 528,281 | 16.5% | 676,320 | 21.1% |
| 2023 | observed | 518,652 | 16.3% | 689,330 | 21.6% |
| 2024 | projected | 509,261 | 16.1% | 703,420 | 22.2% |
| 2025 | projected | 499,655 | 15.9% | 717,822 | 22.9% |
| 2026 | projected | 489,849 | 15.7% | 731,880 | 23.5% |
| 2027 | projected | 479,638 | 15.5% | 744,988 | 24.1% |
| 2028 | projected | 469,760 | 15.3% | 756,708 | 24.7% |
| 2029 | projected | 461,896 | 15.2% | 766,896 | 25.2% |
| 2030 | projected | 455,359 | 15.1% | 775,498 | 25.7% |
| 2031 | projected | 448,989 | 15.0% | 782,286 | 26.2% |
| 2032 | projected | 443,071 | 14.9% | 786,939 | 26.5% |
| 2033 | projected | 437,260 | 14.9% | 789,268 | 26.9% |
| 2034 | projected | 431,100 | 14.8% | 789,622 | 27.1% |
| 2035 | projected | 424,831 | 14.7% | 788,958 | 27.4% |
| 2036 | projected | 418,286 | 14.7% | 788,305 | 27.6% |
| 2037 | projected | 411,786 | 14.6% | 788,387 | 27.9% |
| 2038 | projected | 406,013 | 14.5% | 789,772 | 28.2% |
| 2039 | projected | 400,879 | 14.5% | 792,693 | 28.6% |
| 2040 | projected | 396,286 | 14.4% | 797,089 | 29.0% |
| 2041 | projected | 391,838 | 14.4% | 802,670 | 29.6% |
| 2042 | projected | 387,526 | 14.4% | 808,928 | 30.1% |
| 2043 | projected | 383,366 | 14.4% | 815,438 | 30.7% |
| 2044 | projected | 379,181 | 14.4% | 821,812 | 31.3% |
| 2045 | projected | 374,911 | 14.4% | 827,958 | 31.8% |
| 2046 | projected | 370,394 | 14.4% | 831,700 | 32.4% |
| 2047 | projected | 365,633 | 14.4% | 833,366 | 32.8% |
| 2048 | projected | 360,892 | 14.4% | 834,944 | 33.2% |
| 2049 | projected | 355,995 | 14.3% | 835,512 | 33.6% |
| 2050 | projected | 350,950 | 14.3% | 834,390 | 34.0% |
| 2051 | projected | 345,822 | 14.3% | 831,363 | 34.3% |
| 2052 | projected | 340,664 | 14.2% | 826,998 | 34.5% |
| 2053 | projected | 335,563 | 14.2% | 821,721 | 34.7% |
| 2054 | projected | 330,446 | 14.1% | 814,965 | 34.8% |
| 2055 | projected | 325,183 | 14.1% | 806,986 | 34.9% |
| 2056 | projected | 319,690 | 14.0% | 799,017 | 35.0% |
| 2057 | projected | 314,452 | 14.0% | 790,835 | 35.1% |
| 2058 | projected | 309,567 | 13.9% | 780,256 | 35.1% |
| 2059 | projected | 304,910 | 13.9% | 767,856 | 34.9% |
| 2060 | projected | 300,365 | 13.8% | 755,887 | 34.8% |
| 2061 | projected | 295,956 | 13.8% | 746,194 | 34.8% |
| 2062 | projected | 291,853 | 13.8% | 741,139 | 35.0% |
| 2063 | projected | 287,976 | 13.8% | 738,491 | 35.3% |
| 2064 | projected | 284,204 | 13.8% | 733,737 | 35.5% |
| 2065 | projected | 280,495 | 13.7% | 726,772 | 35.6% |
| 2066 | projected | 276,954 | 13.8% | 719,354 | 35.7% |
| 2067 | projected | 273,579 | 13.8% | 712,327 | 35.8% |
| 2068 | projected | 270,492 | 13.8% | 705,915 | 35.9% |
| 2069 | projected | 267,700 | 13.8% | 699,839 | 36.1% |
| 2070 | projected | 264,905 | 13.8% | 693,679 | 36.2% |
| 2071 | projected | 262,202 | 13.9% | 686,894 | 36.3% |
| 2072 | projected | 259,661 | 13.9% | 679,802 | 36.4% |
| 2073 | projected | 257,215 | 13.9% | 672,840 | 36.4% |
| 2074 | projected | 254,755 | 14.0% | 666,589 | 36.5% |
| 2075 | projected | 252,185 | 14.0% | 660,580 | 36.7% |
| 2076 | projected | 249,616 | 14.0% | 653,424 | 36.7% |
| 2077 | projected | 247,097 | 14.1% | 645,727 | 36.7% |
| 2078 | projected | 244,562 | 14.1% | 638,432 | 36.7% |
| 2079 | projected | 241,985 | 14.1% | 630,927 | 36.7% |
| 2080 | projected | 239,370 | 14.1% | 623,485 | 36.7% |
| 2081 | projected | 236,711 | 14.1% | 616,654 | 36.8% |
| 2082 | projected | 234,007 | 14.1% | 610,365 | 36.8% |
| 2083 | projected | 231,178 | 14.1% | 605,017 | 36.9% |
| 2084 | projected | 228,288 | 14.1% | 600,059 | 37.0% |
| 2085 | projected | 225,476 | 14.1% | 594,820 | 37.1% |
| 2086 | projected | 222,685 | 14.0% | 589,062 | 37.2% |
| 2087 | projected | 219,931 | 14.0% | 582,769 | 37.2% |
| 2088 | projected | 217,233 | 14.0% | 576,326 | 37.1% |
| 2089 | projected | 214,549 | 14.0% | 569,987 | 37.1% |
| 2090 | projected | 211,980 | 14.0% | 563,797 | 37.1% |
| 2091 | projected | 209,539 | 13.9% | 557,781 | 37.1% |
| 2092 | projected | 207,113 | 13.9% | 551,935 | 37.1% |
| 2093 | projected | 204,668 | 13.9% | 546,224 | 37.1% |
| 2094 | projected | 202,297 | 13.9% | 540,689 | 37.1% |
| 2095 | projected | 200,035 | 13.9% | 535,322 | 37.1% |
| 2096 | projected | 197,748 | 13.9% | 530,139 | 37.2% |
| 2097 | projected | 195,390 | 13.9% | 525,108 | 37.2% |
| 2098 | projected | 193,175 | 13.8% | 520,253 | 37.3% |
| 2099 | projected | 191,199 | 13.8% | 515,601 | 37.3% |
| 2100 | projected | 189,294 | 13.9% | 511,118 | 37.4% |